What This Document Is
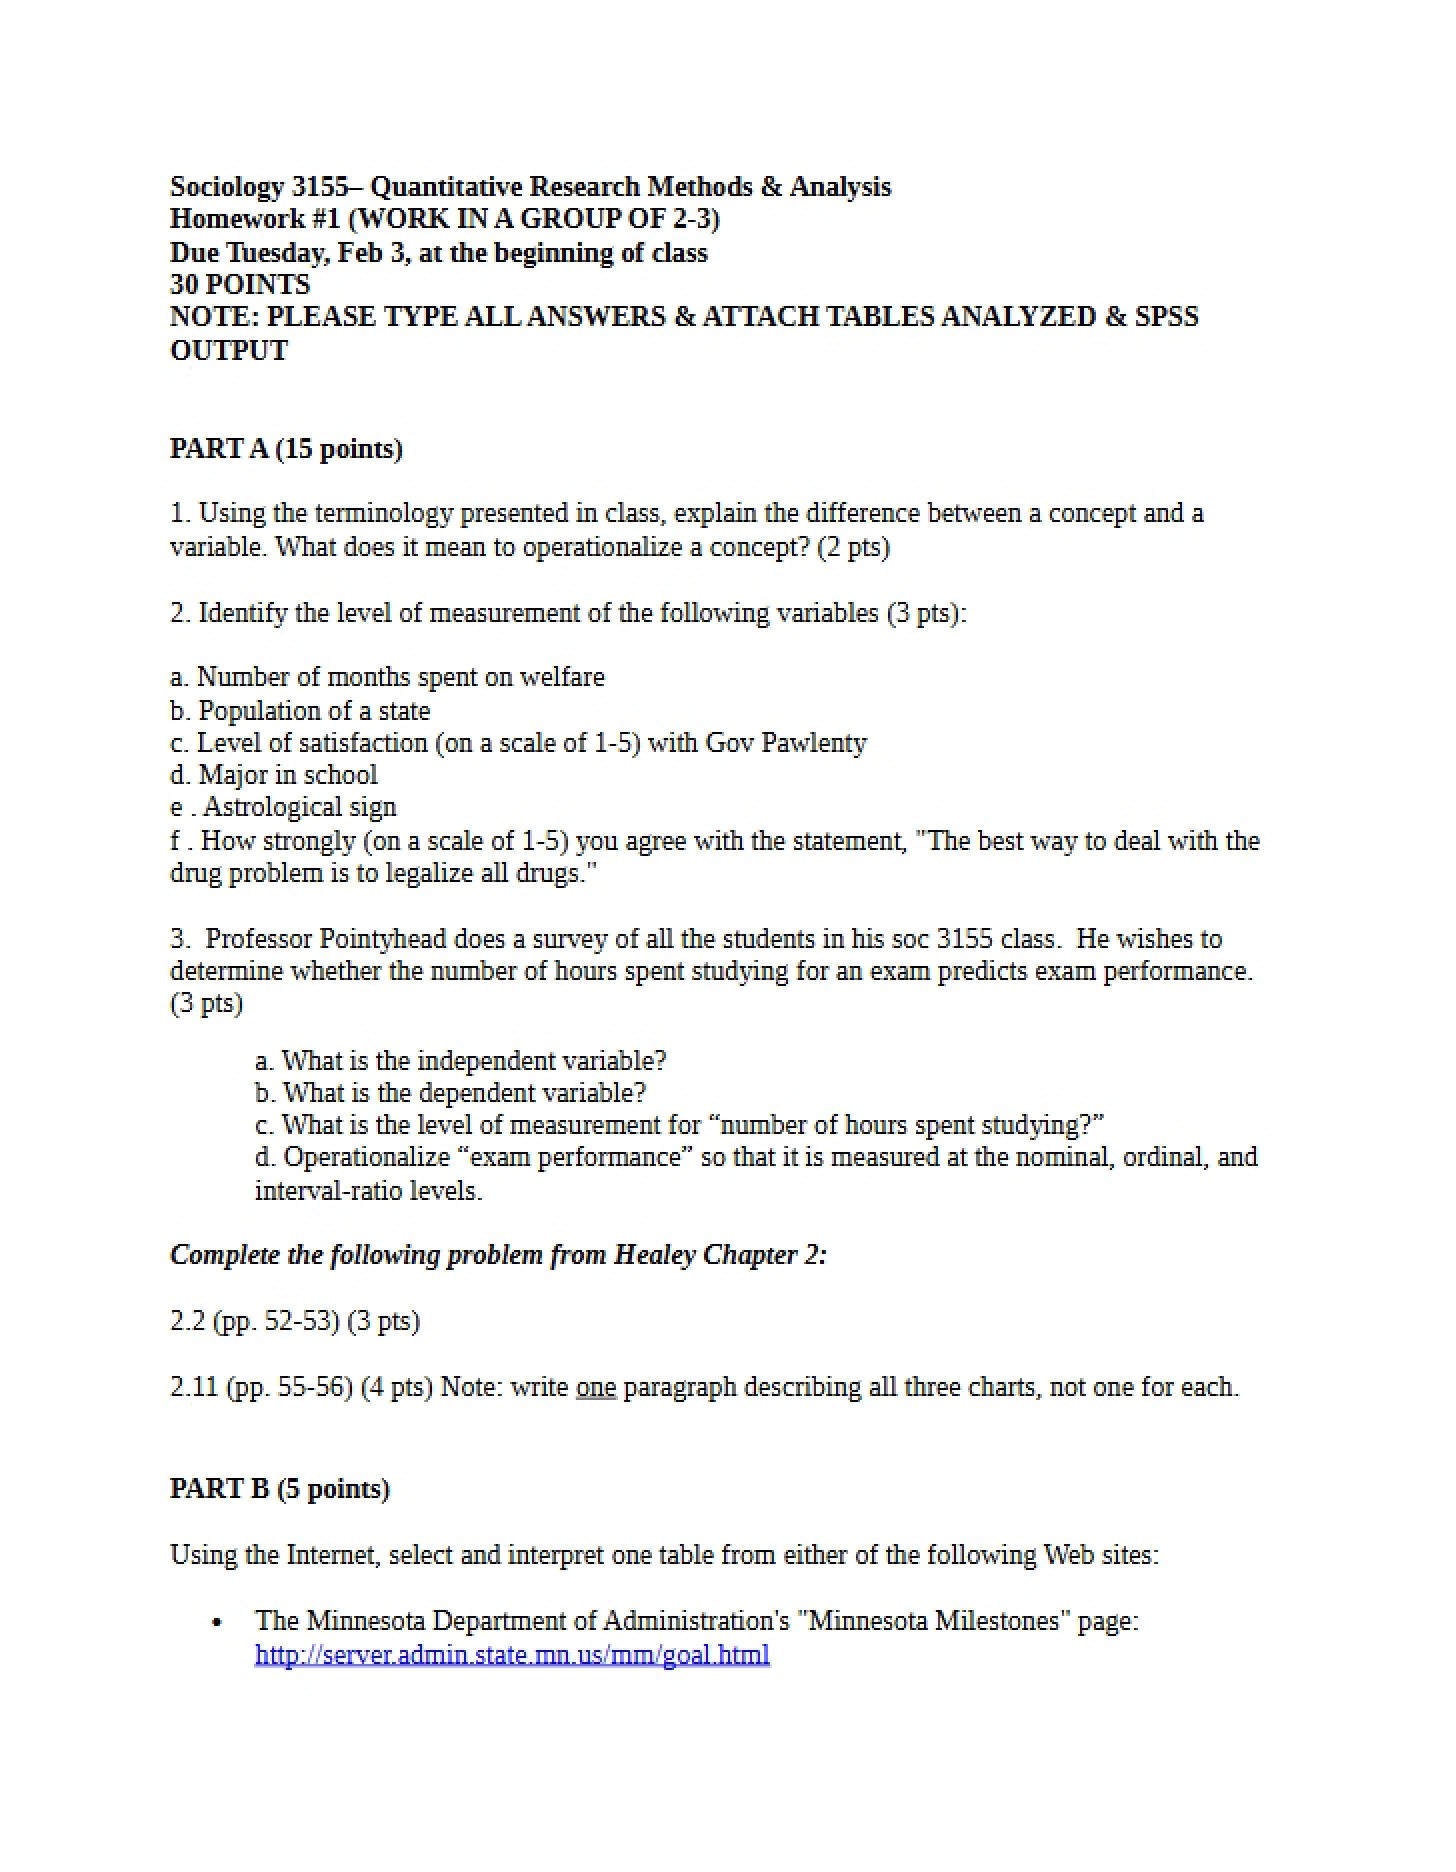
This is a homework assignment for SOC 3155: Quantitative Research Methods and Analysis, offered at the University of Minnesota Twin Cities. It focuses on applying statistical concepts to analyze relationships between variables. The assignment is designed to test your understanding of measures of association, hypothesis testing, and data interpretation using real or provided datasets. It builds upon core principles taught in the course and requires practical application of those principles.
Why This Document Matters
This assignment is crucial for students enrolled in quantitative research methods courses. Successfully completing it demonstrates your ability to select appropriate statistical tests, interpret SPSS output, and articulate the strength and significance of relationships observed in data. It’s particularly helpful when preparing for exams or future research projects where you’ll need to analyze and report findings. If you are actively learning about chi-square, Cramer’s V, Lambda, regression analysis, Pearson’s r, and Gamma, this assignment will provide valuable practice.
Common Limitations or Challenges
This assignment does *not* provide a step-by-step tutorial on how to perform each analysis. It assumes you have a foundational understanding of the statistical concepts and SPSS software. It also doesn’t offer pre-calculated results or interpretations; you are expected to independently apply your knowledge to the provided data and questions. Access to the 2006 GSS data is also a prerequisite for completing certain sections.
What This Document Provides
* A series of questions requiring application of measures of association for both nominal/ordinal and interval-ratio variables.
* Exercises involving interpretation of SPSS crosstabulation output.
* Tasks requiring the use of SPSS to analyze datasets and generate relevant statistics.
* Problems focused on formulating null hypotheses and determining statistical significance.
* Opportunities to practice describing relationships between variables using appropriate percentages and statistical measures.
* Questions relating to regression analysis, including interpreting slope, y-intercept, and the coefficient of determination.