What This Document Is
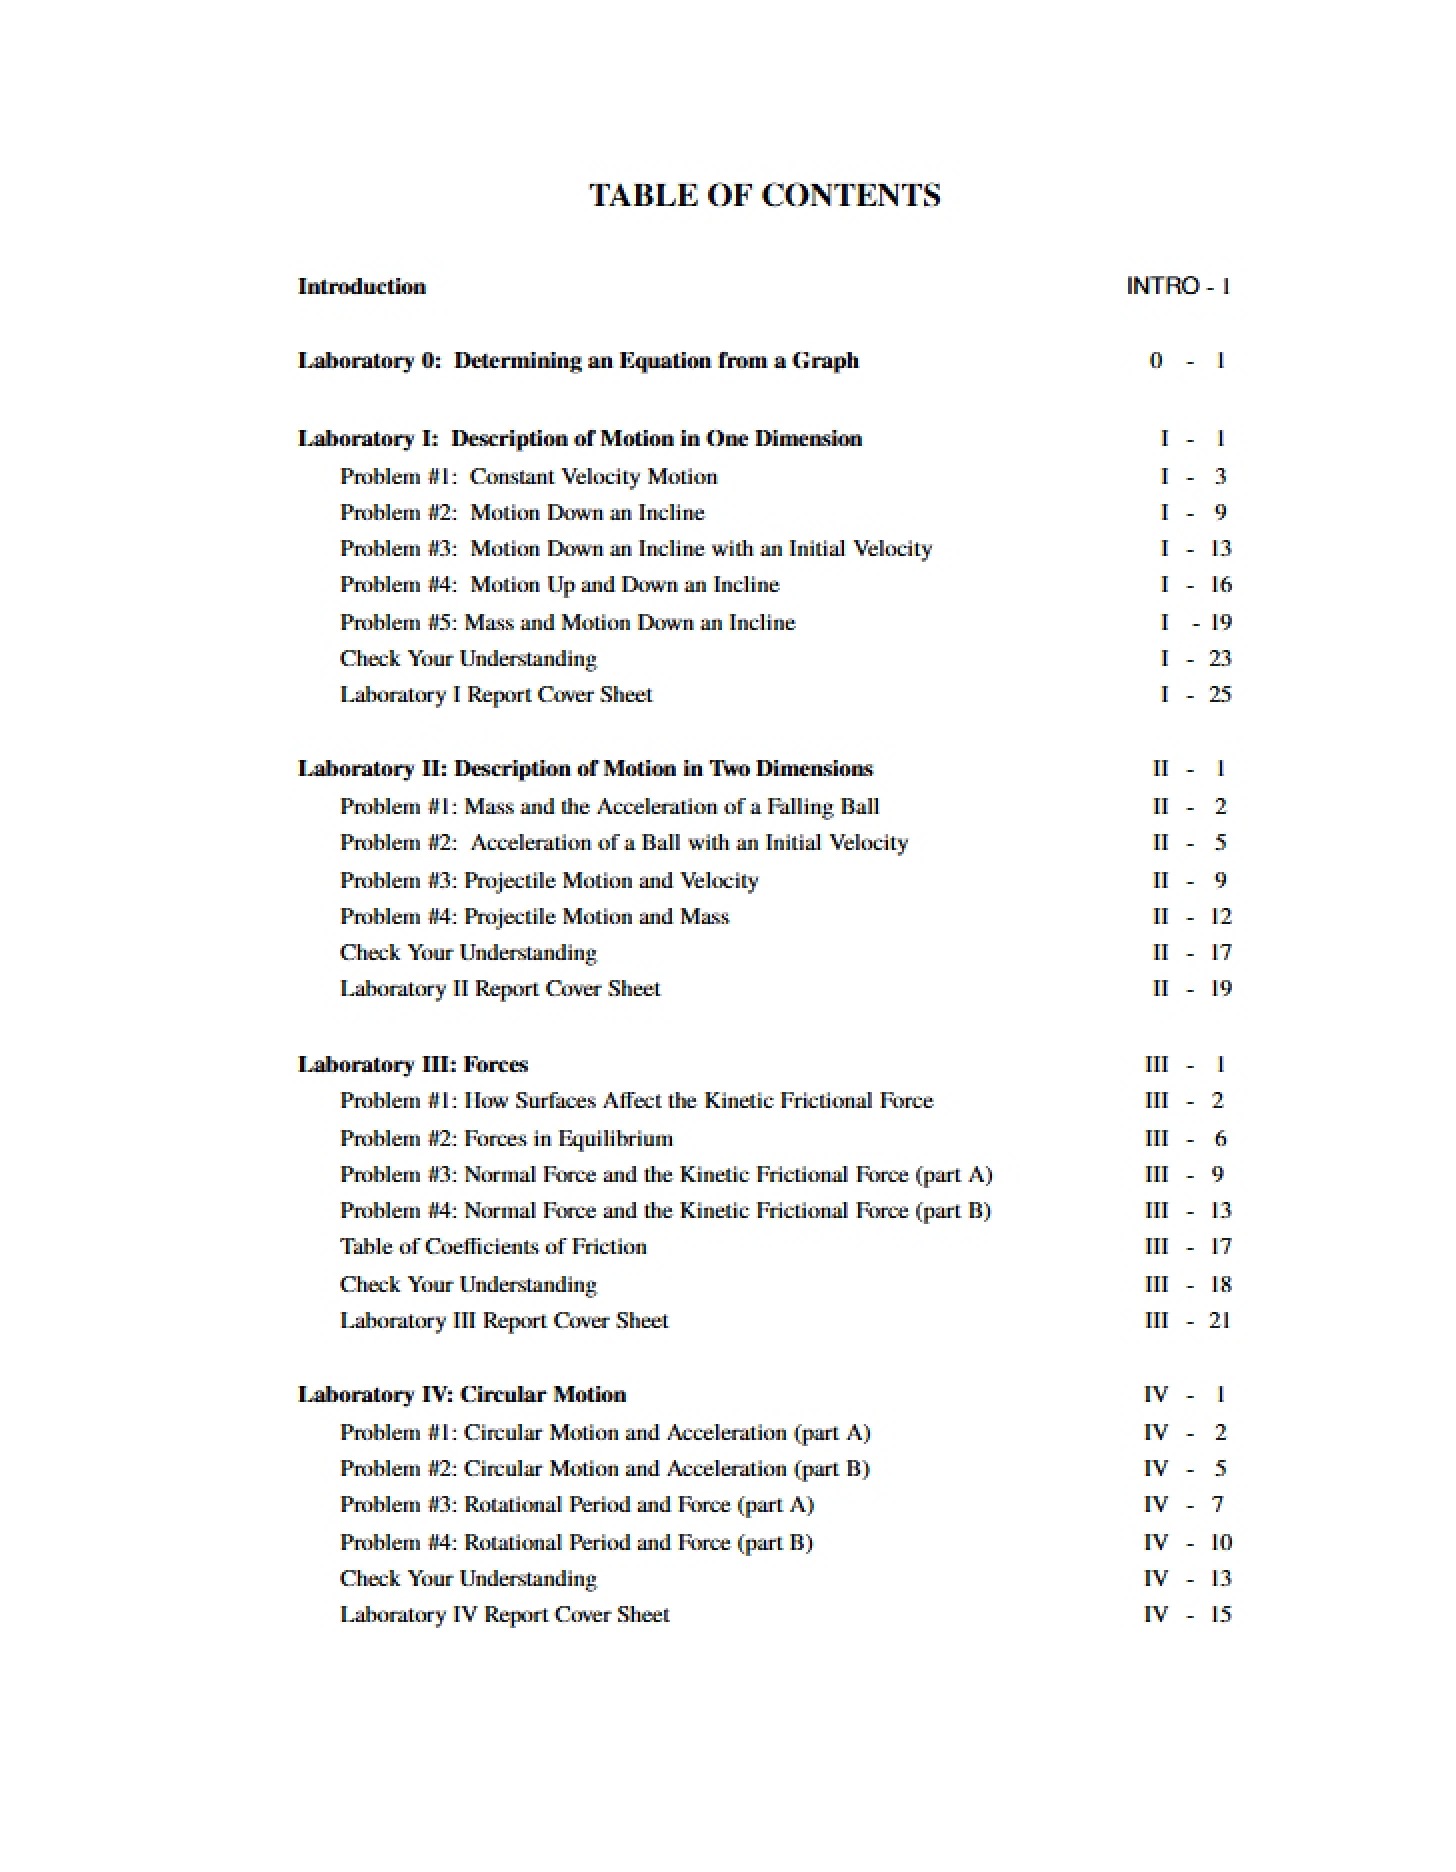
This is a laboratory instruction guide for PHYS 1101, Introduction to Physics at the University of Minnesota Twin Cities. Specifically, it focuses on the foundational skill of determining mathematical equations from graphical data – a core practice in physics. It details an introductory exercise designed to build proficiency in using software to analyze and interpret experimental results. The guide prepares students for a common workflow: predicting physical behavior with equations, collecting data, and then refining those equations to best *fit* the observed data.
Why This Document Matters
This resource is essential for students beginning their physics journey, particularly those who may be less familiar with data analysis techniques. It’s most valuable *before* and *during* laboratory sessions where students are expected to independently analyze data and draw conclusions. Understanding the principles outlined here will improve accuracy in data interpretation, strengthen equation-fitting skills, and ultimately lead to a deeper understanding of physical phenomena. Students will find this particularly helpful when transitioning from theoretical concepts to practical application.
Common Limitations or Challenges
This guide provides a framework for the equation-fitting process, but it does *not* offer pre-solved examples or step-by-step solutions. It focuses on the conceptual understanding of *how* to approach the problem, rather than providing specific answers. It also assumes a basic familiarity with common function types (linear, exponential, etc.) and, while mentioning calculus, doesn’t provide a calculus tutorial. The guide is designed to be used *in conjunction* with the PracticeFit software, and access to that software is a prerequisite for completing the exercise.
What This Document Provides
* An overview of the iterative process of prediction, measurement, and equation fitting.
* Guidance on selecting appropriate equation types based on graphical characteristics.
* A discussion of how to interpret key features of a graph (intercepts, slopes, asymptotic behavior) to determine equation constants.
* Questions designed to prompt critical thinking about the relationship between equations and physical phenomena.
* Considerations for evaluating the quality of a fit and determining acceptable levels of discrepancy.