What This Document Is
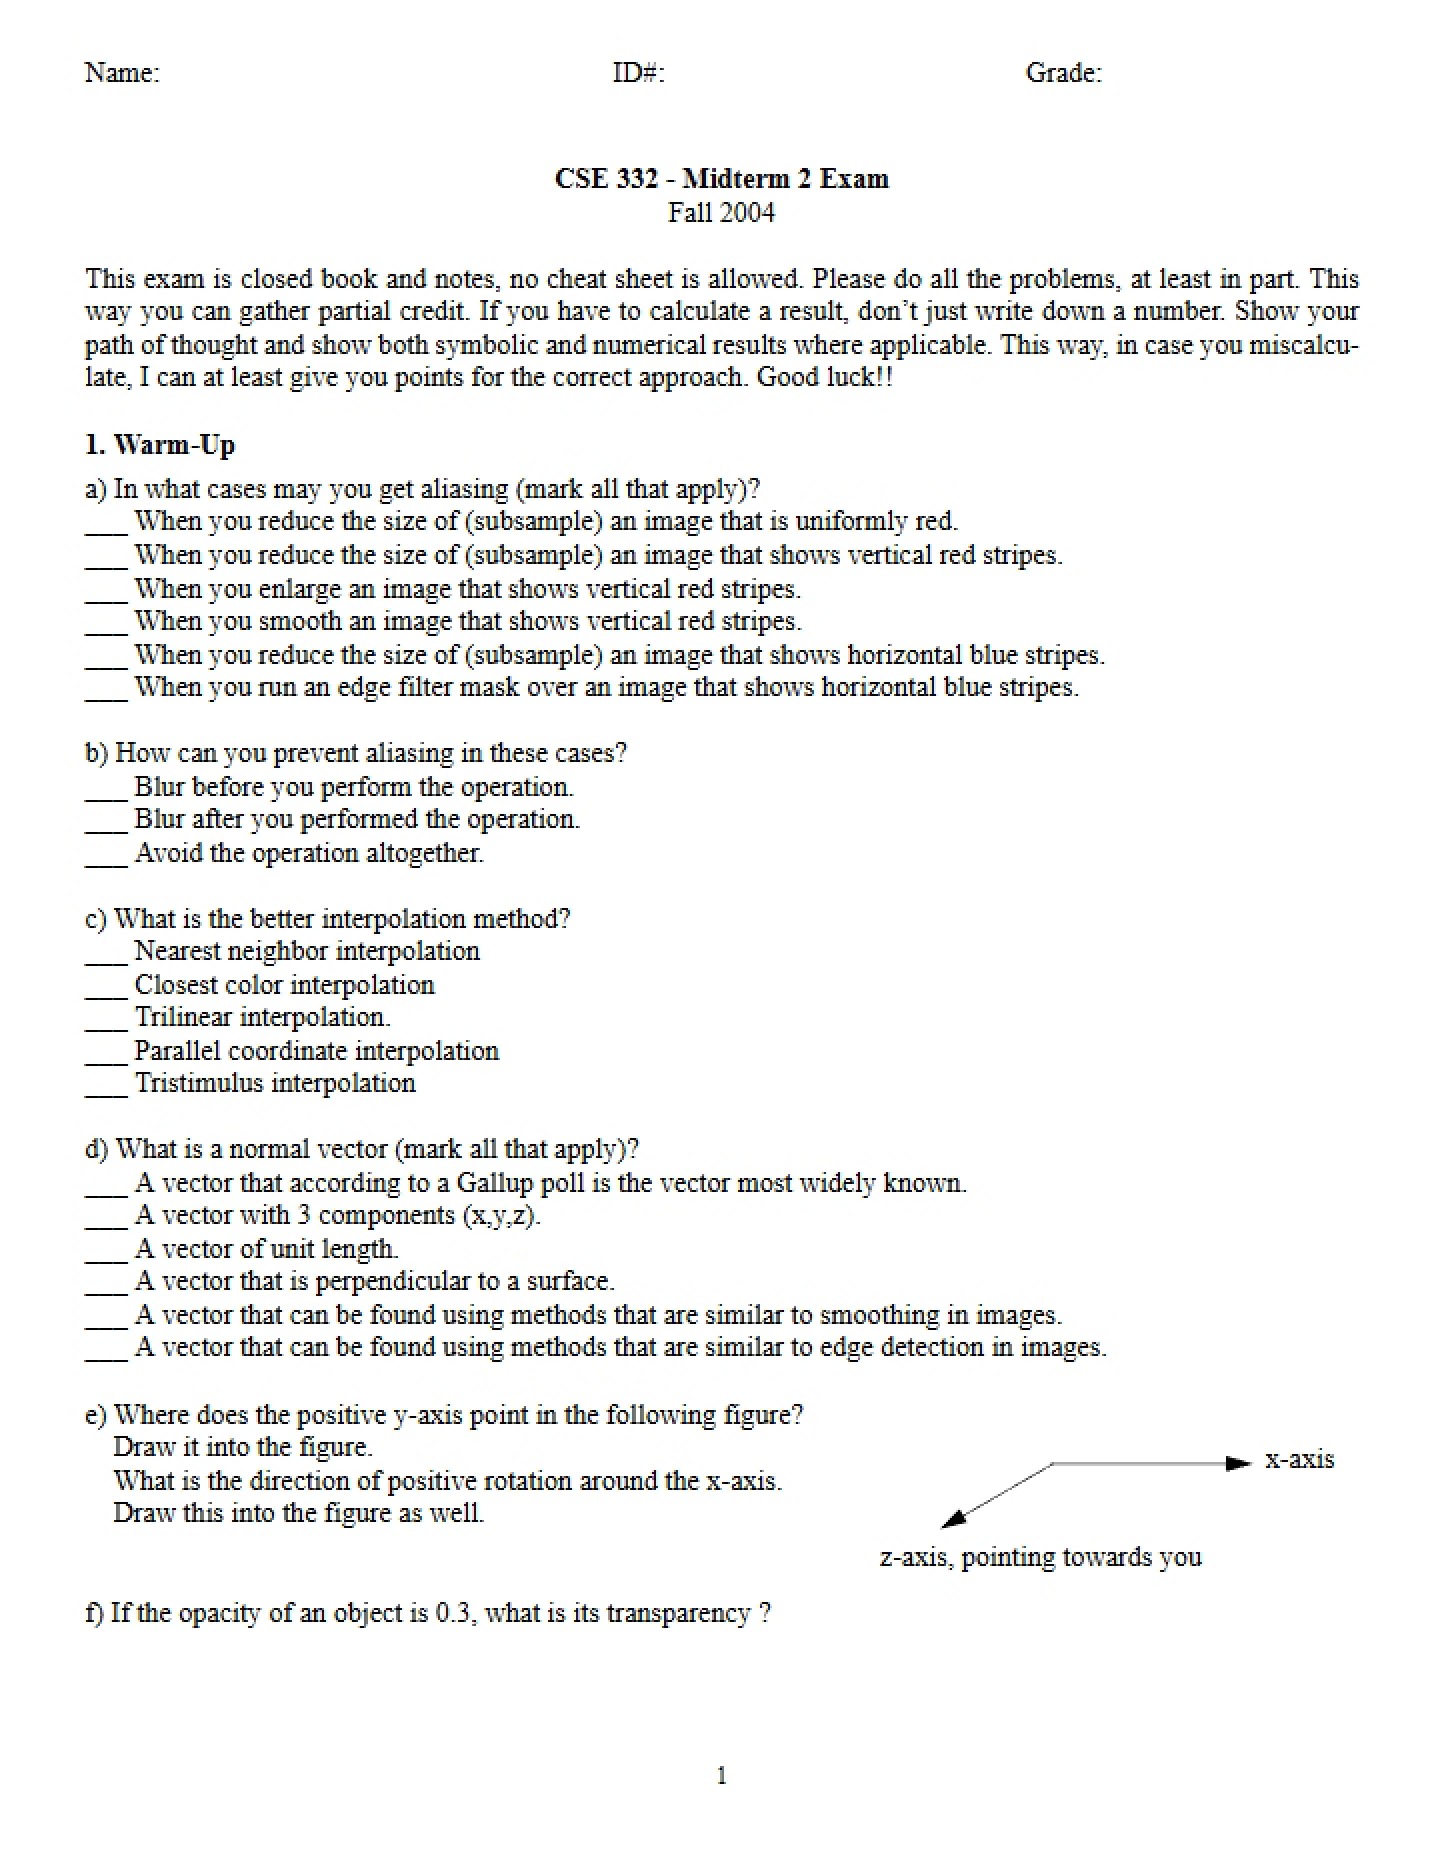
This guide serves as a focused review resource for Midterm Two in CSE 332: Introduction to Visualization at Stony Brook University. It consolidates essential concepts and techniques covered in the course, designed to help you prepare for a comprehensive assessment of your understanding. The material centers around the principles of effectively representing data visually, moving beyond basic charts to explore more sophisticated methods.
Why This Document Matters
This study guide is invaluable for students aiming to solidify their grasp of visualization principles before the midterm examination. It’s particularly helpful for those who want a structured overview of the key areas emphasized in the course, and a focused resource for targeted review. Use this guide to identify areas where you feel confident and pinpoint topics needing further attention. It’s best utilized in the days leading up to the midterm as a final check of your understanding.
Topics Covered
* Data Types and Structures: Understanding the characteristics of different data formats.
* Data Transformation Techniques: Preparing non-numerical data for visualization.
* Fundamental Chart Types: Exploring the appropriate use of common visualizations.
* Advanced Visualization Methods: Investigating techniques for complex datasets.
* Data Refinement: Methods for improving clarity and reducing noise in visualizations.
* Graphics Fundamentals: Distinguishing between vector and raster graphics.
* Statistical Considerations: Applying statistical principles to visualization design.
* Visualization Tools & Libraries: An overview of popular software and coding libraries.
What This Document Provides
* A consolidated overview of core visualization concepts.
* A structured framework for reviewing key topics.
* Identification of important techniques for data representation.
* Insight into the strengths and weaknesses of various visualization approaches.
* A summary of commonly used tools in the field of data visualization.