What This Document Is
This is a completed assignment for STAT 1000Q at the University of Connecticut, focusing on practical application of introductory statistical concepts using Minitab software. It demonstrates a student’s ability to interpret and analyze data presented in various graphical formats and draw meaningful conclusions. The assignment centers around analyzing real-world datasets related to university demographics and enrollment trends.
Why This Document Matters
This resource is ideal for students currently enrolled in or preparing for Intro to Statistics courses. It’s particularly helpful for those seeking to understand how to effectively apply statistical methods to interpret data and communicate findings. Reviewing a completed assignment can provide valuable insight into expectations, common approaches to problem-solving, and the level of detail required for successful submissions. It’s best used *after* attempting the assignment independently, as a way to check your work and identify areas for improvement.
Topics Covered
* Data Visualization: Pie charts vs. Bar graphs
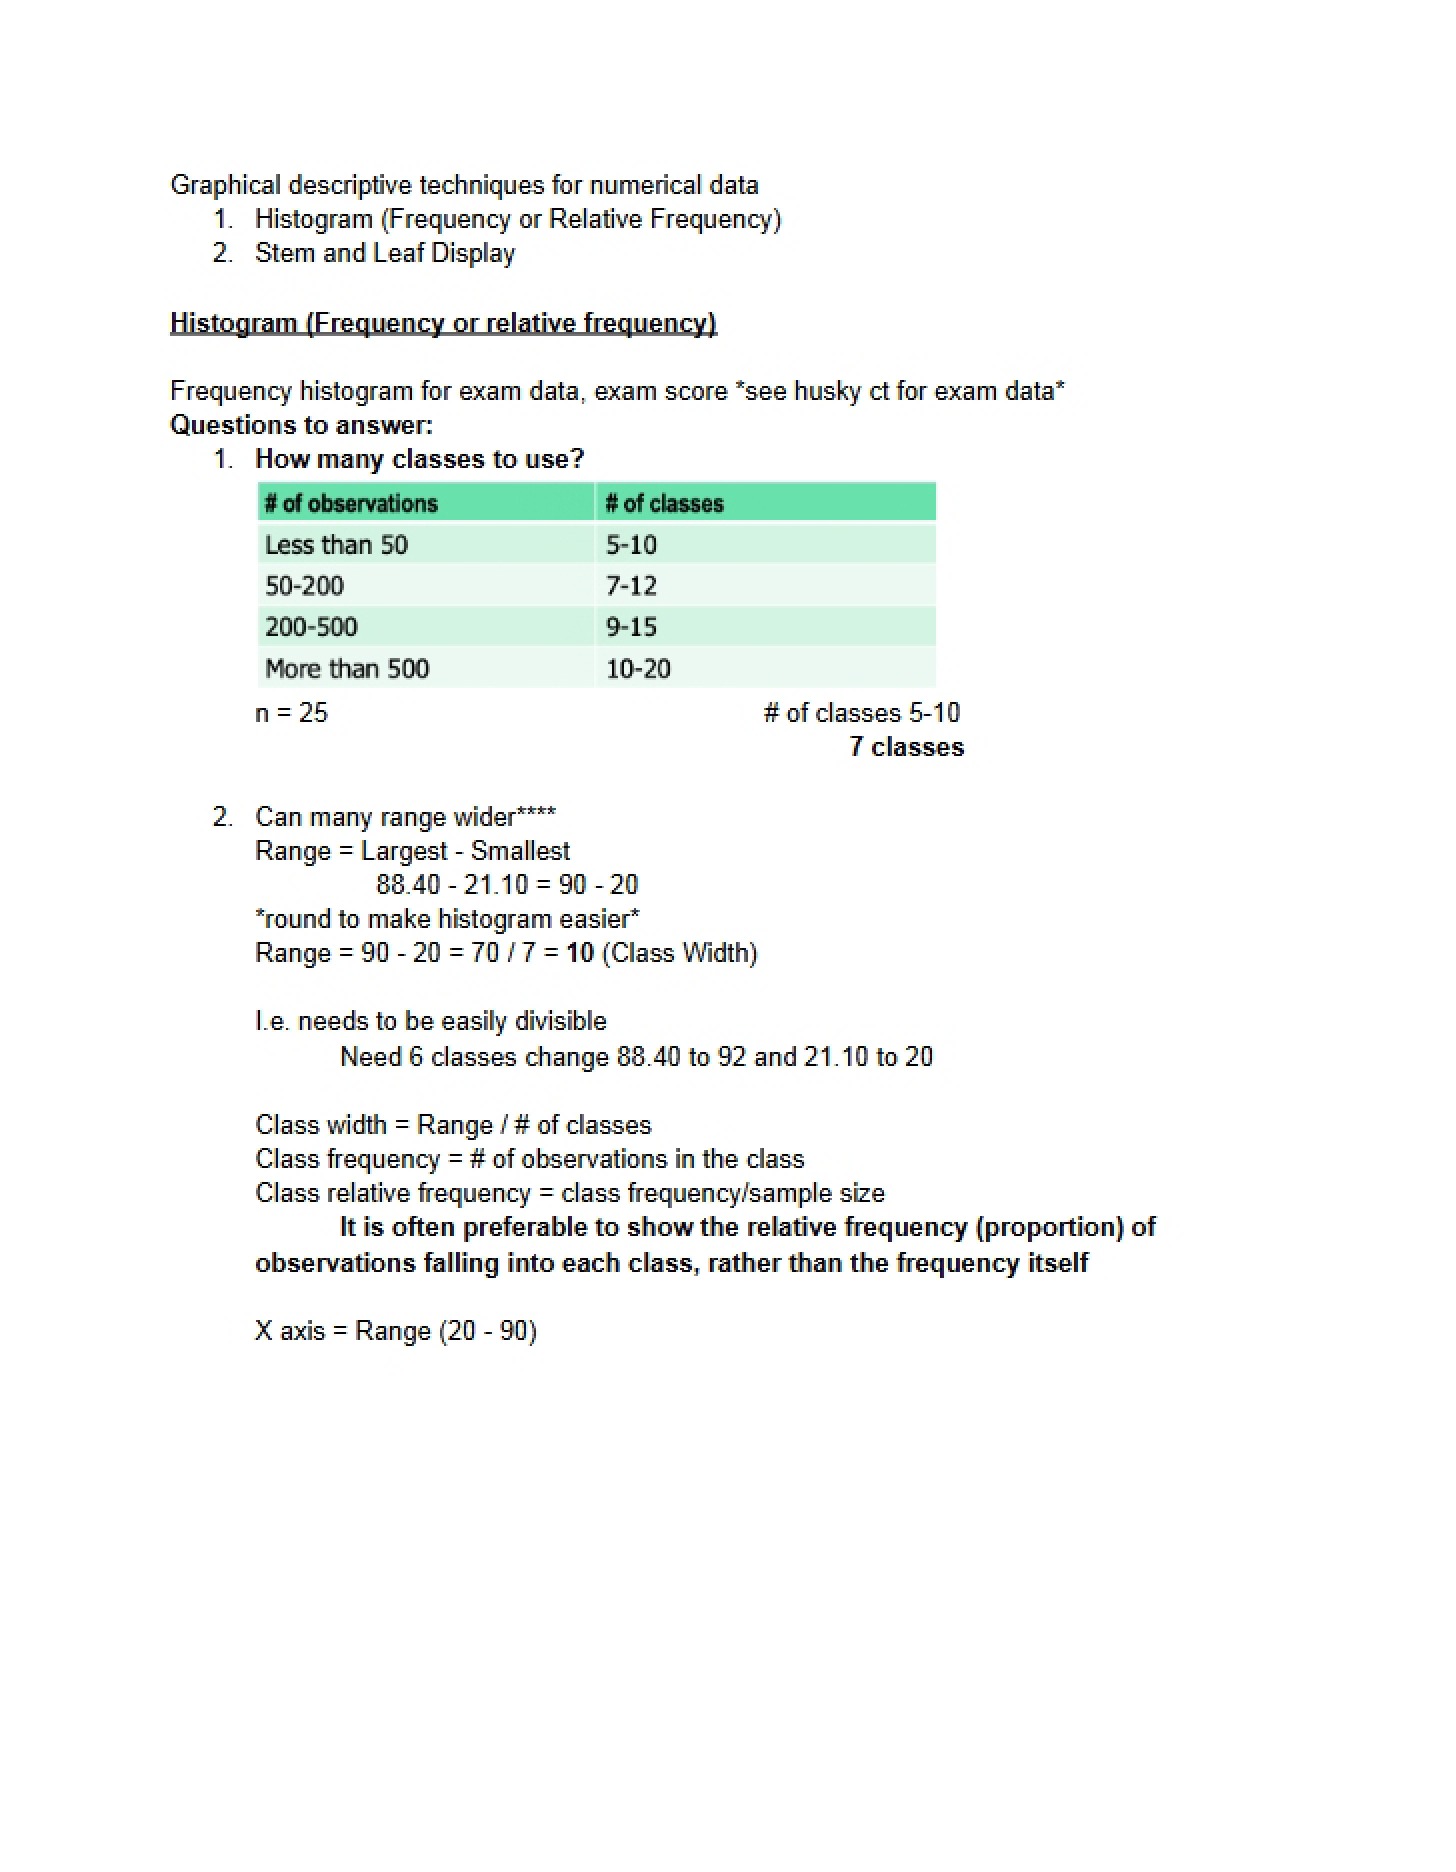
* Graphical Interpretation: Extracting insights from visual representations of data
* Enrollment Analysis: Examining trends in student populations over time
* Comparative Analysis: Identifying differences and similarities across datasets
* Statistical Communication: Articulating findings based on data analysis
* Minitab Application: Practical use of statistical software for data exploration
What This Document Provides
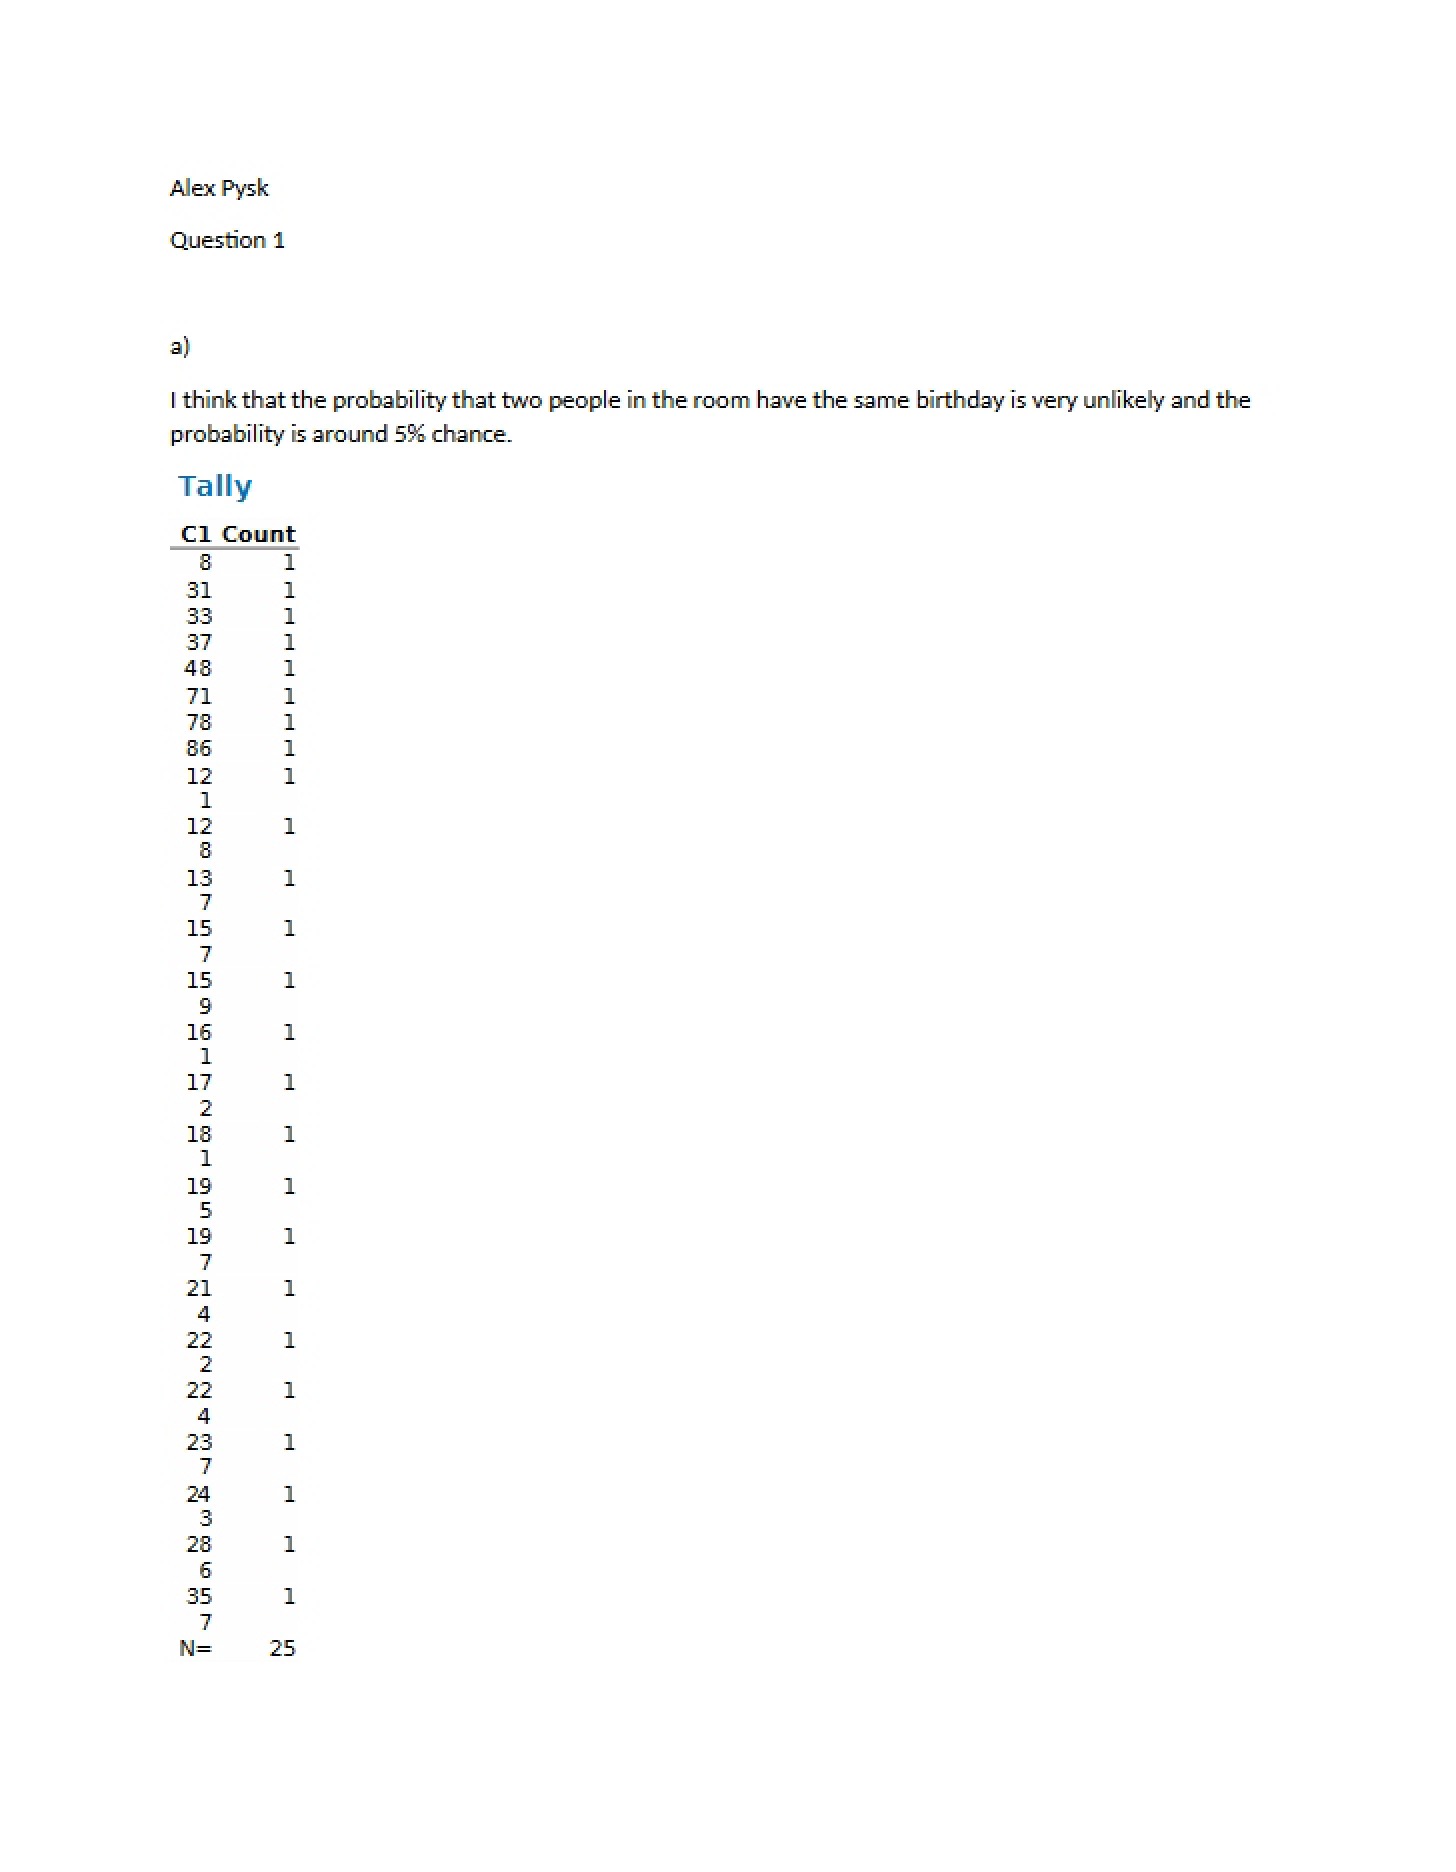
* A completed assignment demonstrating a student’s approach to statistical problems.
* Analysis of datasets related to ethnic background within a student body.
* Interpretation of enrollment figures across different academic schools over multiple years.
* Observations and conclusions drawn from graphical data representations.
* Examples of how to describe trends and patterns observed in statistical data.
* A framework for understanding how to present statistical findings in a clear and concise manner.