What This Document Is
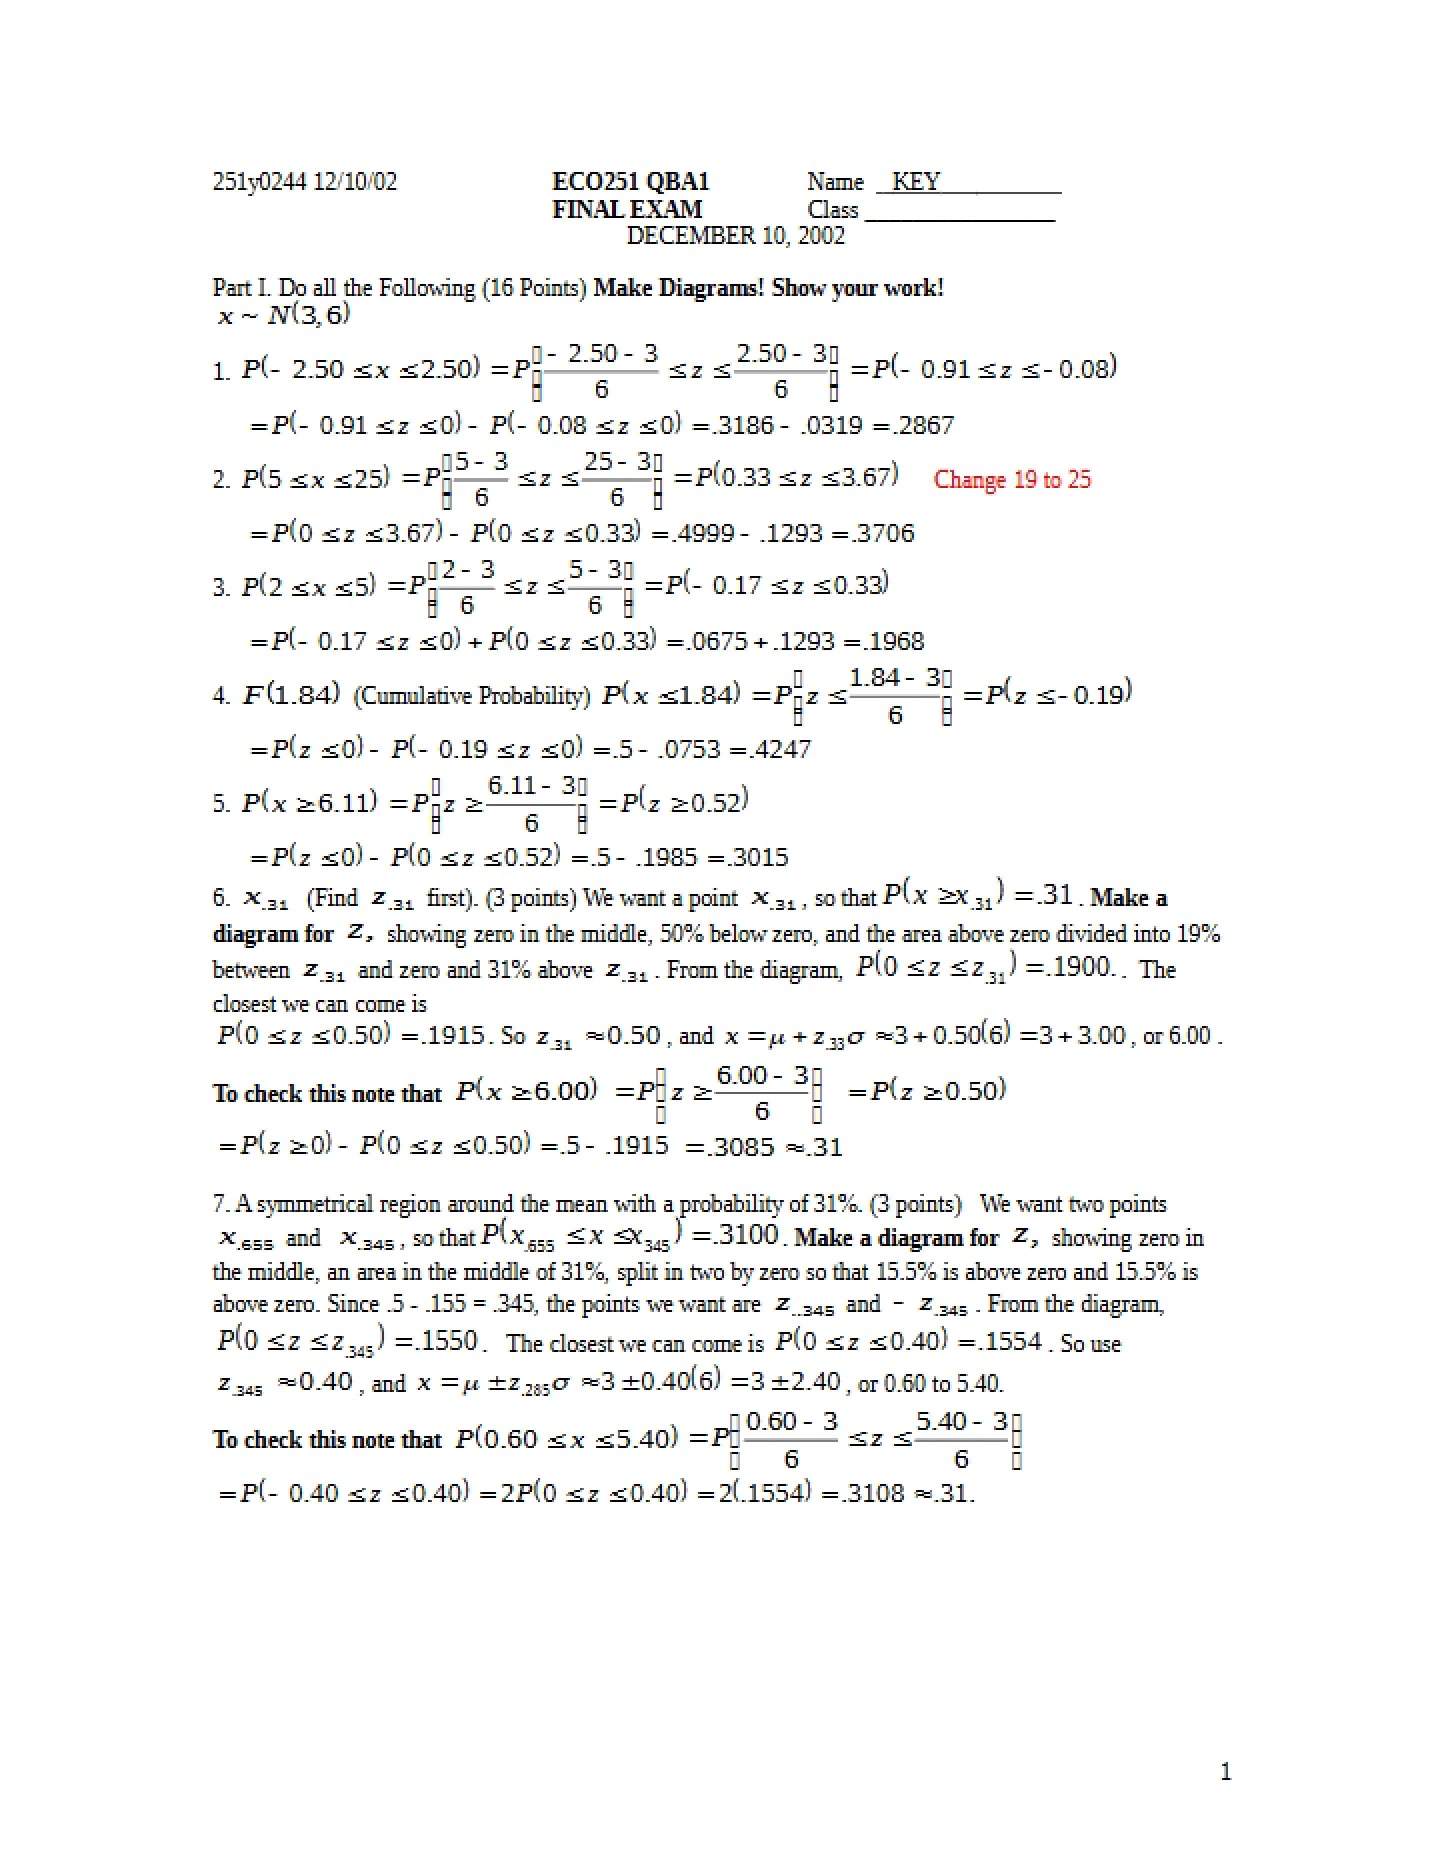
This study guide provides a focused review of key concepts within Quantitative Business Analysis I (ECO 251) at West Chester University of Pennsylvania. It centers around descriptive statistics – the methods used to summarize and understand data. The material revisits both grouped and ungrouped data scenarios, offering a comprehensive look at how to analyze datasets of varying formats. It’s designed to reinforce understanding of foundational statistical principles essential for success in the course.
Why This Document Matters
This resource is ideal for ECO 251 students looking to solidify their grasp of descriptive statistics before quizzes, exams, or assignments. It’s particularly helpful if you’re revisiting the material after a lecture or are working through practice problems and need a consolidated reference. Students who struggle with applying statistical formulas or interpreting results will find this guide a valuable tool for building confidence and improving their analytical skills. It’s best used *in conjunction* with course lectures and assigned readings, not as a replacement for them.
Common Limitations or Challenges
This guide focuses specifically on descriptive statistics and does *not* cover inferential statistics, regression analysis, or other advanced topics within Quantitative Business Analysis. It assumes a basic understanding of mathematical concepts and statistical terminology as introduced in the course. While it presents a structured review, it does not offer step-by-step solutions to every possible problem type; rather, it illustrates the *process* of applying statistical methods. It is not a substitute for actively working through problems yourself.
What This Document Provides
* A review of statistical calculations for both grouped and ungrouped datasets.
* Discussions of measures of central tendency, including mean, median, and mode.
* Explanations of measures of dispersion, such as variance, standard deviation, and interquartile range.
* Coverage of different methods for assessing data skewness and its interpretation.
* A framework for understanding Pearson’s measure of skewness.
* Guidance on interpreting statistical results in the context of business analysis.