What This Document Is
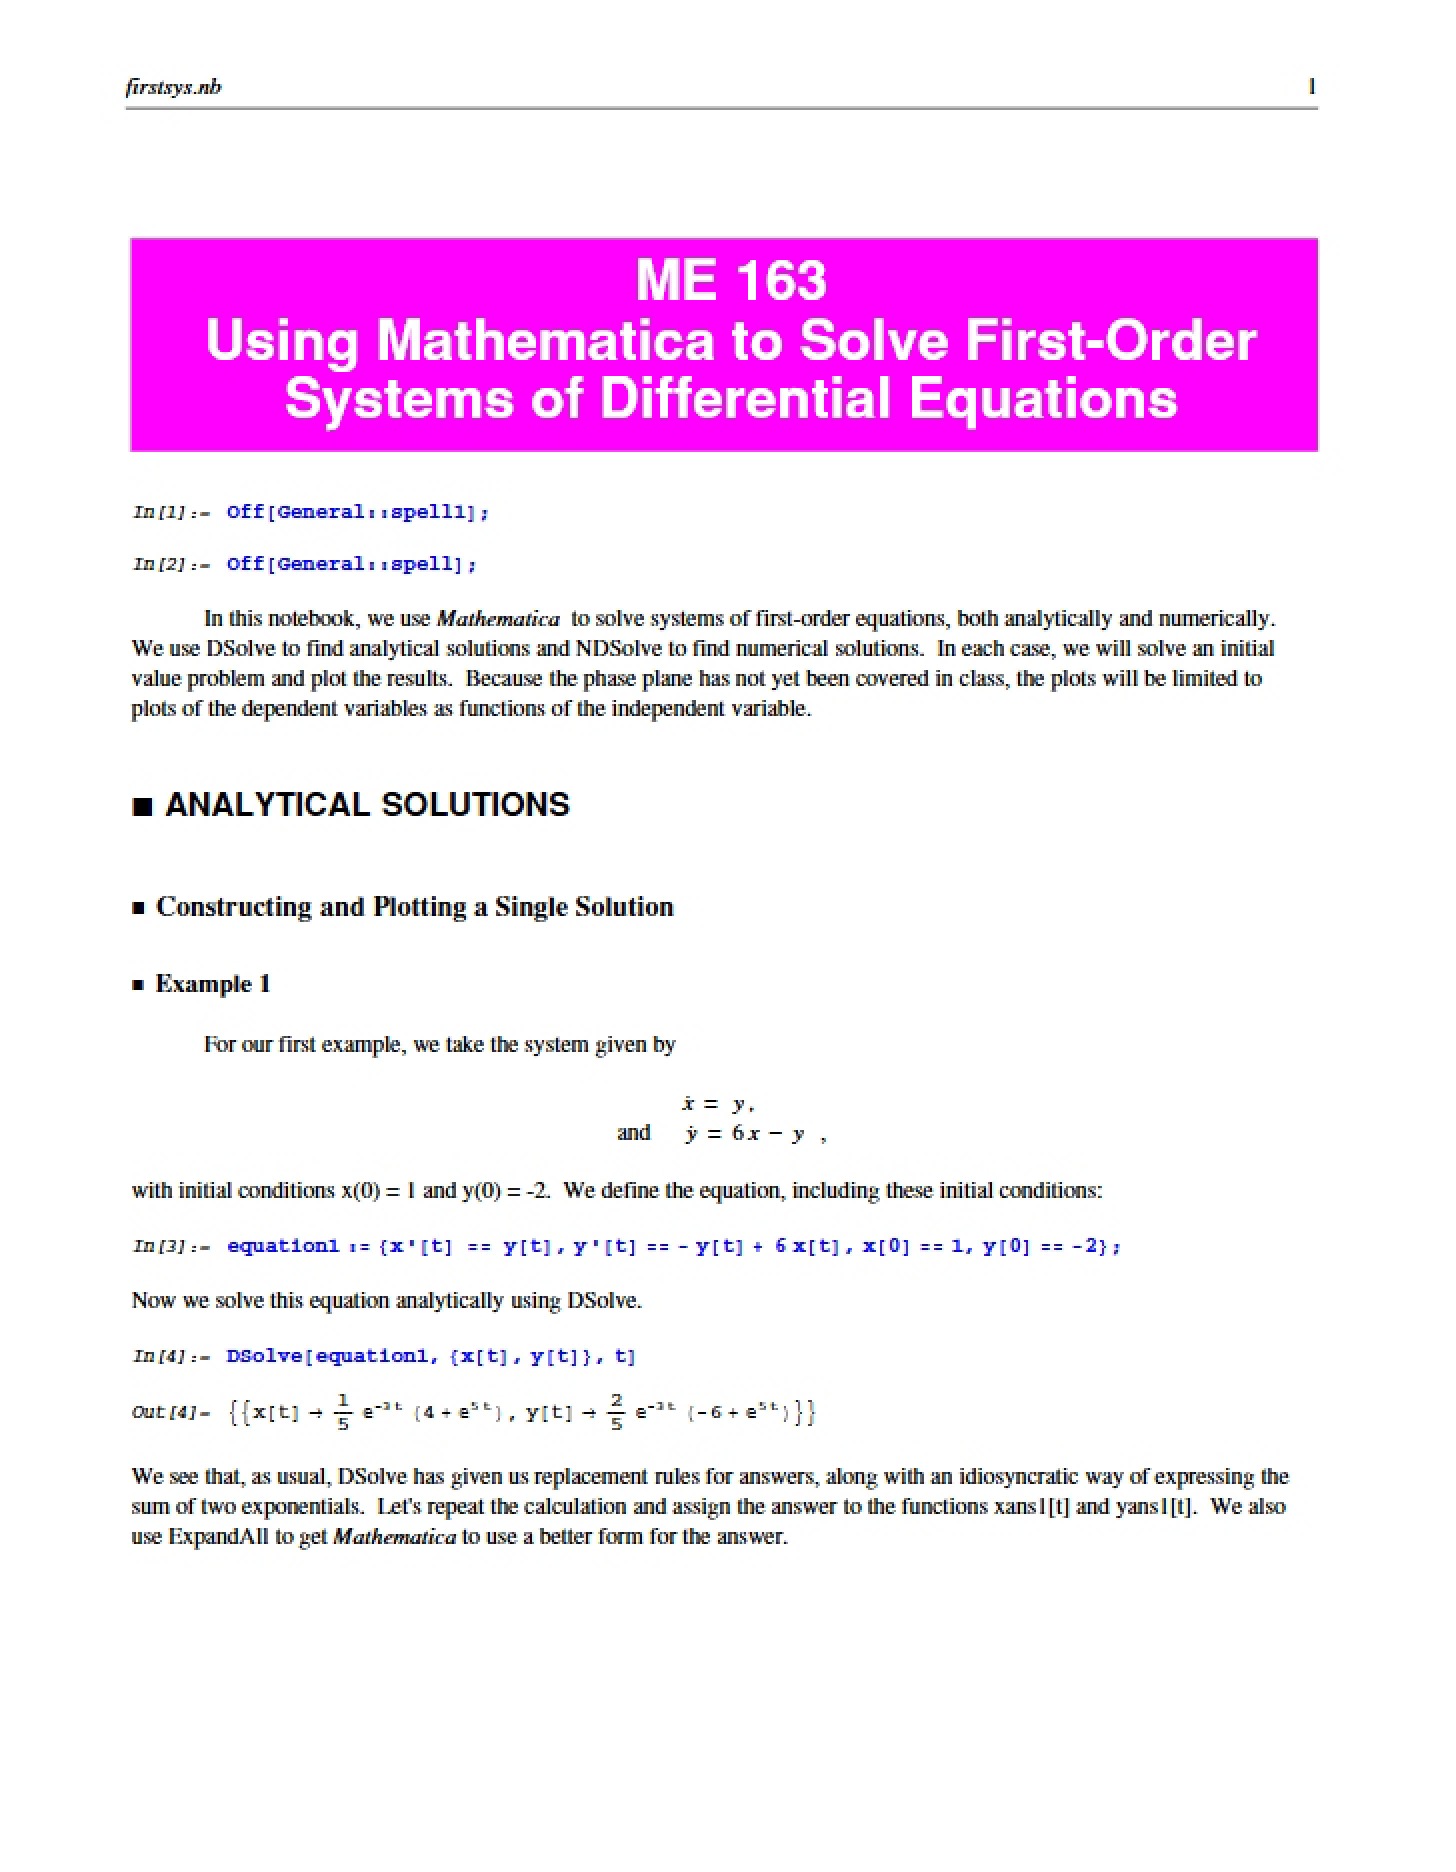
This is a focused instructional guide detailing the application of specialized software – Mathematica – to visualize solutions of differential equations. Specifically, it centers on the creation of phase plane plots, a powerful tool for understanding the qualitative behavior of dynamical systems. The material builds upon foundational knowledge of solving systems of first-order equations, particularly those explored using numerical methods. It’s designed for students learning to represent and interpret the dynamics of these systems graphically.
Why This Document Matters
This resource is ideal for students enrolled in applied differential equations courses, particularly those in mechanical engineering or related fields. It’s most beneficial when you’re tasked with analyzing the stability and long-term behavior of systems modeled by differential equations and need a visual method to confirm your analytical work. Students who struggle with visualizing solutions or understanding the relationship between equations and their graphical representations will find this particularly helpful. It bridges the gap between theoretical concepts and practical application using industry-standard software.
Common Limitations or Challenges
This guide focuses specifically on utilizing Mathematica for phase plane analysis. It assumes a basic familiarity with both differential equations and the Mathematica programming environment. It does *not* provide a comprehensive introduction to differential equations themselves, nor does it offer a full tutorial on Mathematica’s general functionalities. The guide concentrates on the techniques for generating plots and interpreting the resulting visualizations, rather than deriving the equations being plotted.
What This Document Provides
* An explanation of the `ParametricPlot` command within Mathematica and its application to visualizing orbits.
* A structured approach to combining numerical solution techniques (like `NDSolve`) with graphical representation.
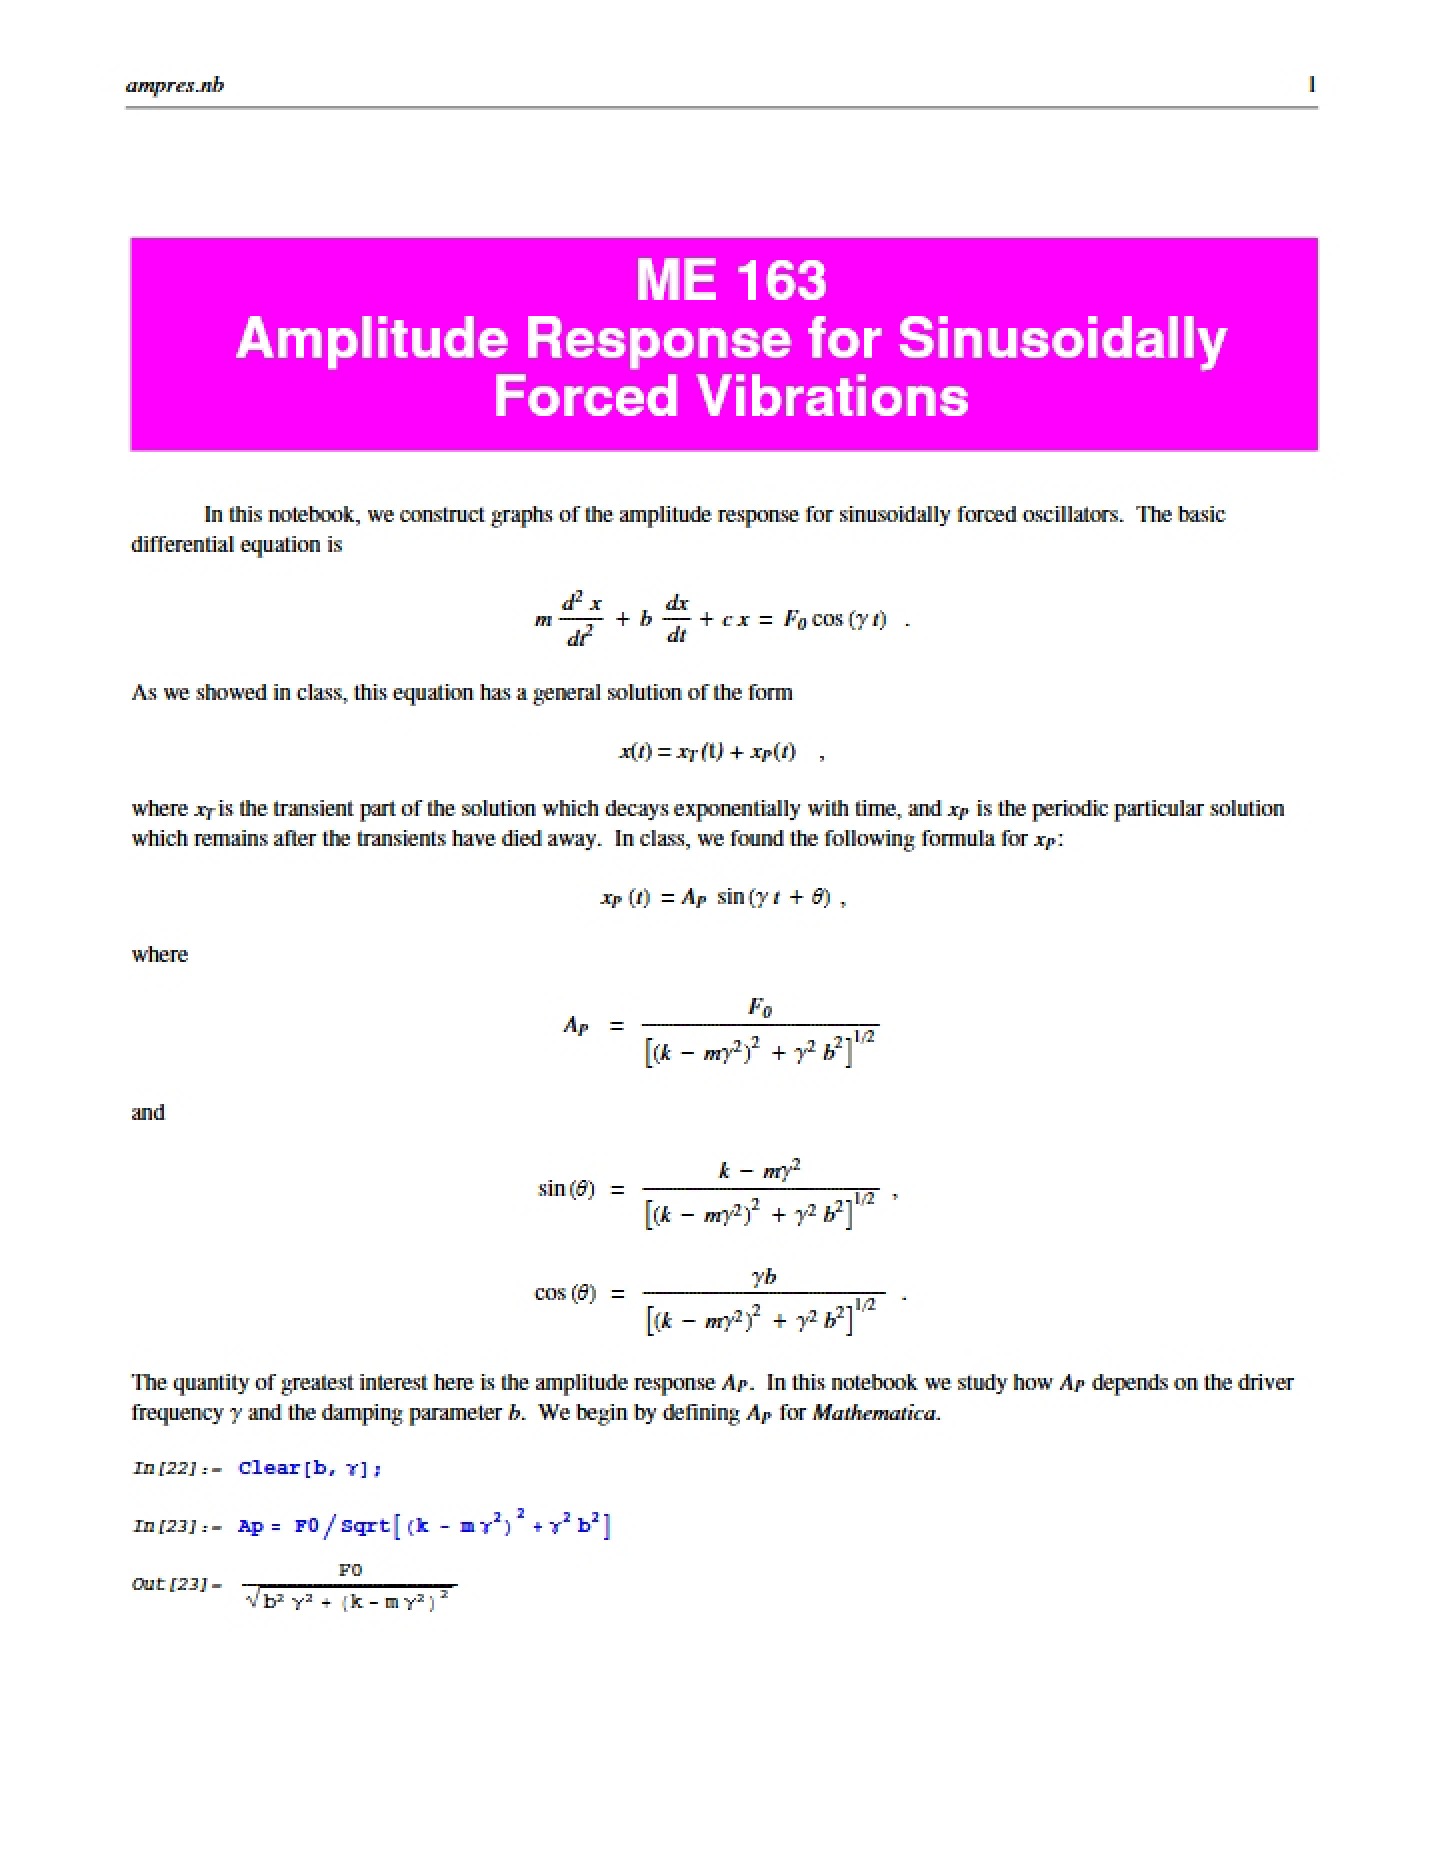
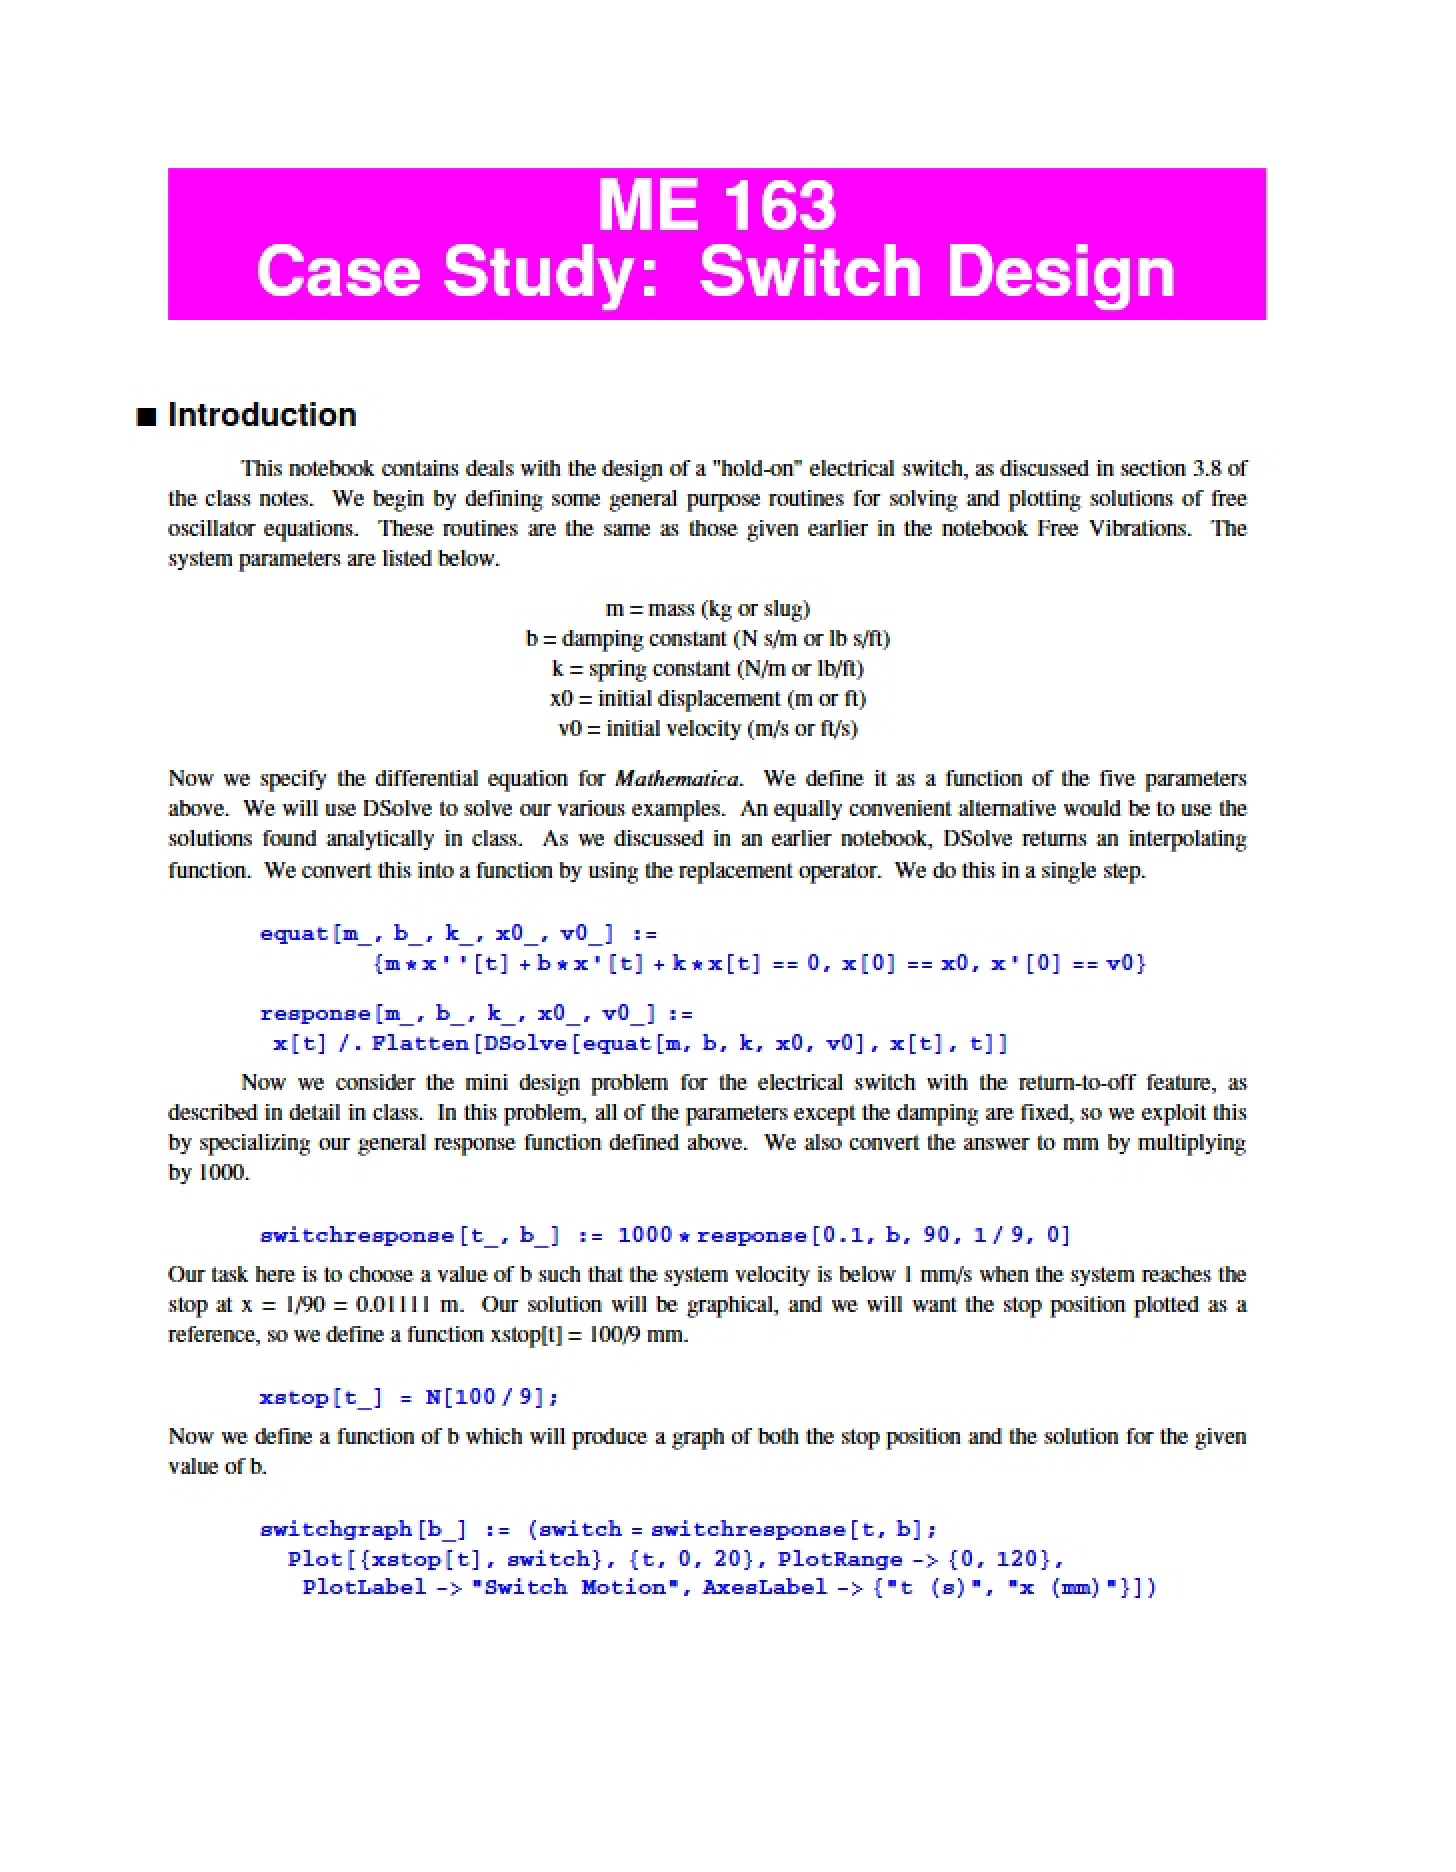
* A canonical example – the damped harmonic oscillator – used to illustrate the process and test implementation.
* Several illustrative examples showcasing different types of solution behaviors in autonomous systems.
* Guidance on customizing plot appearance, including axis labels, plot ranges, and aspect ratios.