What This Document Is
This resource is a focused guide to effective graphing techniques within a physics laboratory setting. It delves into the principles of visually representing experimental data, moving beyond simply creating a picture to utilizing graphs as powerful analytical tools. It’s designed to help students understand *how* to communicate scientific findings clearly and accurately through graphical representation. The material centers around best practices for constructing and interpreting graphs commonly used in introductory physics experiments.
Why This Document Matters
This guide is essential for any student enrolled in an introductory physics course, particularly those involving hands-on laboratory work. It’s most beneficial when you’re preparing to record, analyze, and present data from experiments. Mastering these graphing skills will not only improve your lab reports but also strengthen your overall understanding of the relationships between physical quantities. It’s a valuable resource for students who find visualizing data challenging or want to ensure their graphs meet professional scientific standards.
Common Limitations or Challenges
This guide focuses on the *principles* of graphing and doesn’t provide step-by-step instructions for specific software packages (like Excel or LabVIEW). It won’t walk you through calculations or provide pre-solved examples. It also assumes a basic understanding of experimental data collection and the concepts of uncertainty in measurements. It’s a foundational resource, and may need to be supplemented with additional instruction on data analysis techniques.
What This Document Provides
* Guidance on the essential elements of a well-constructed graph.
* Discussion of how to appropriately scale and label graph axes.
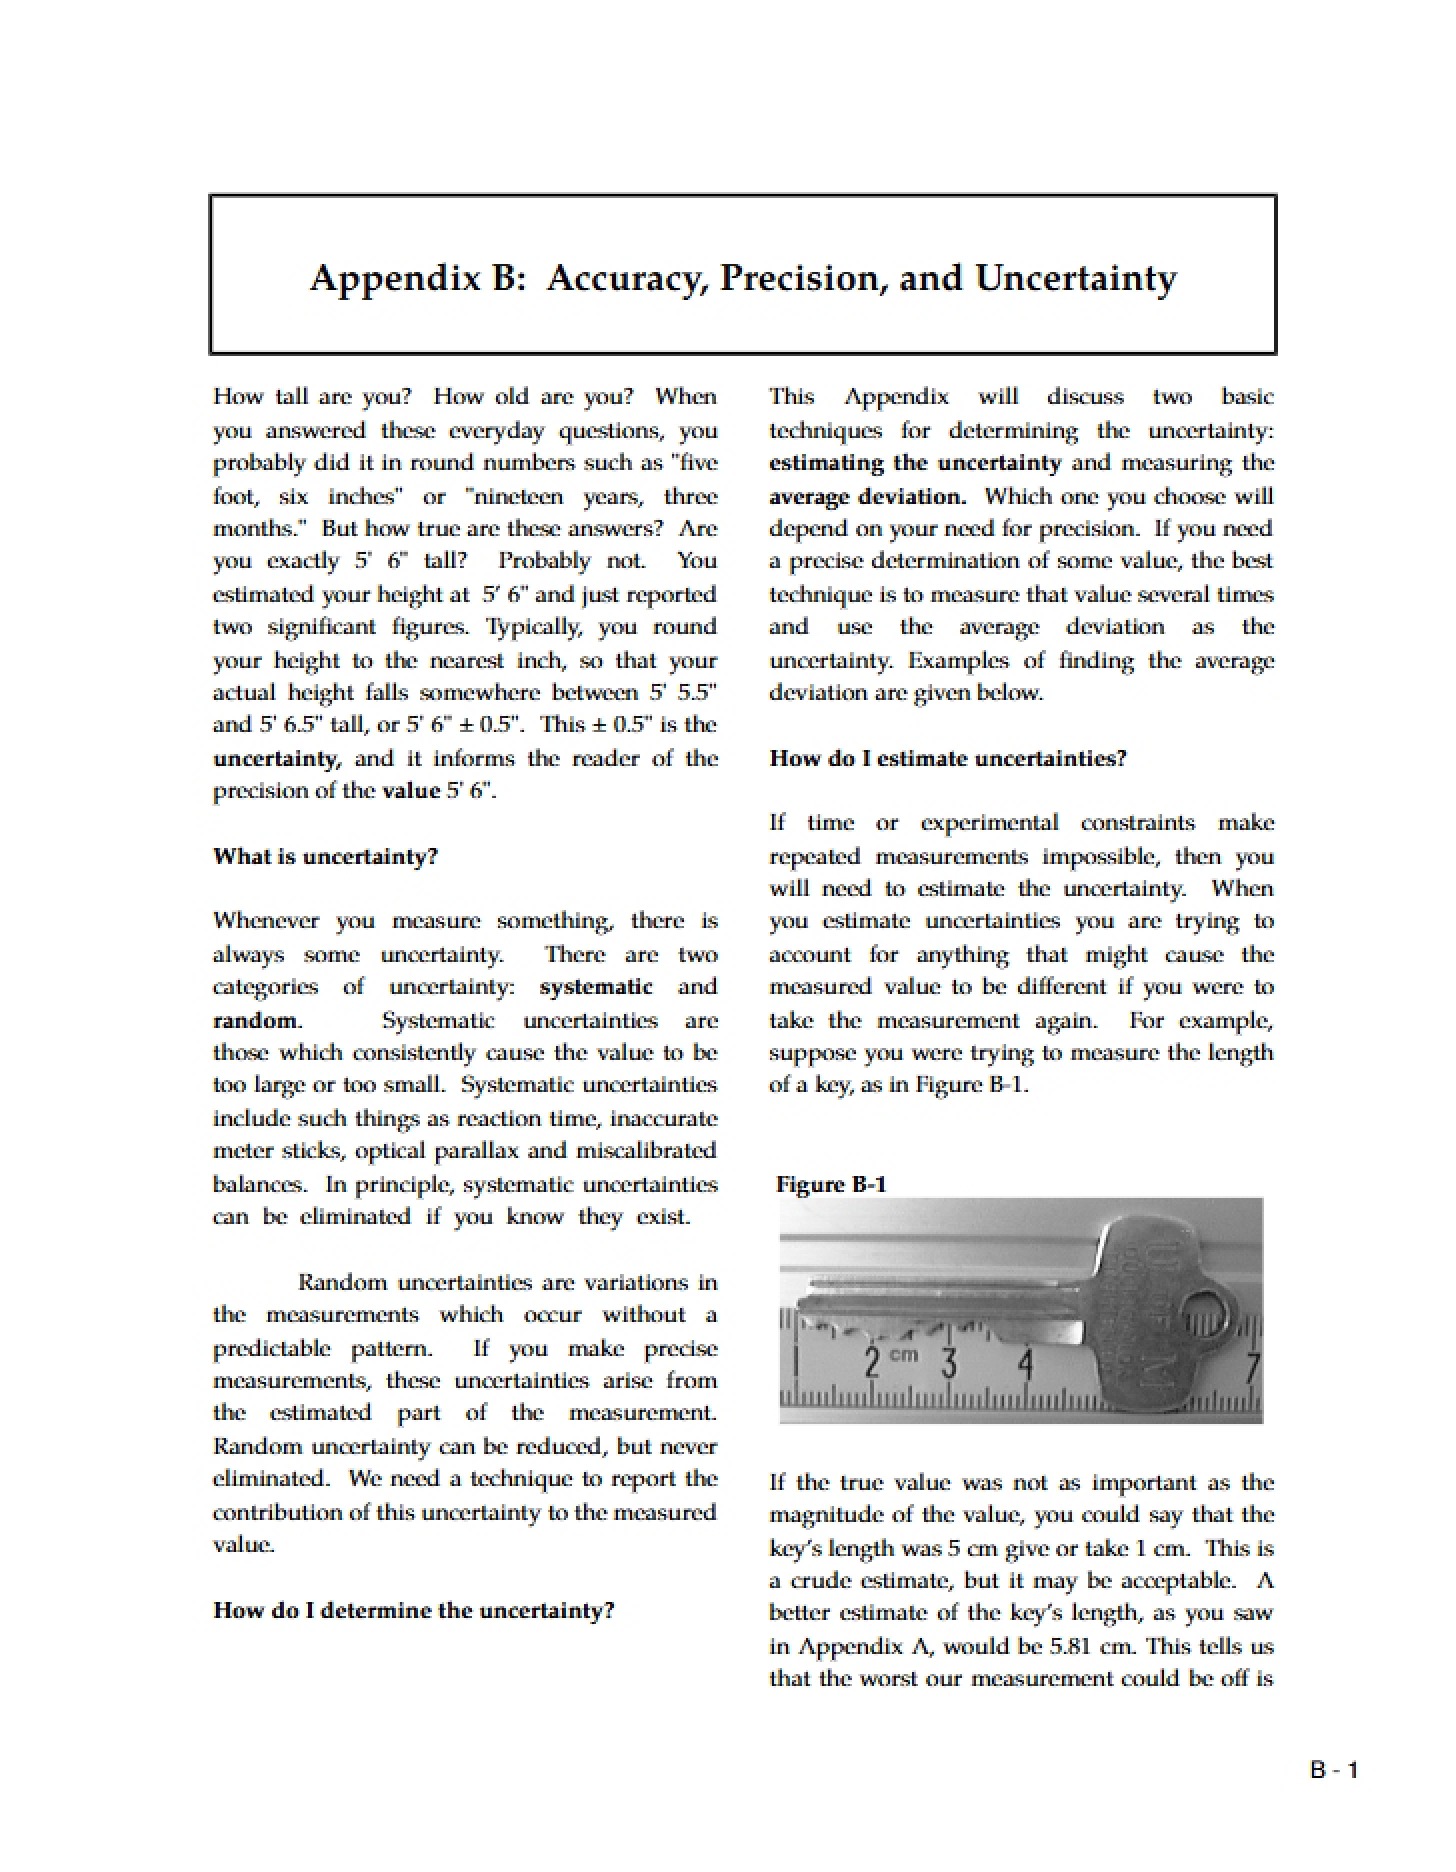
* Explanation of how to visually represent data uncertainty.
* Insight into determining the best-fit representation of a dataset.
* Considerations for creating clear and informative graph titles.
* An example illustrating data presentation in both tabular and graphical formats.