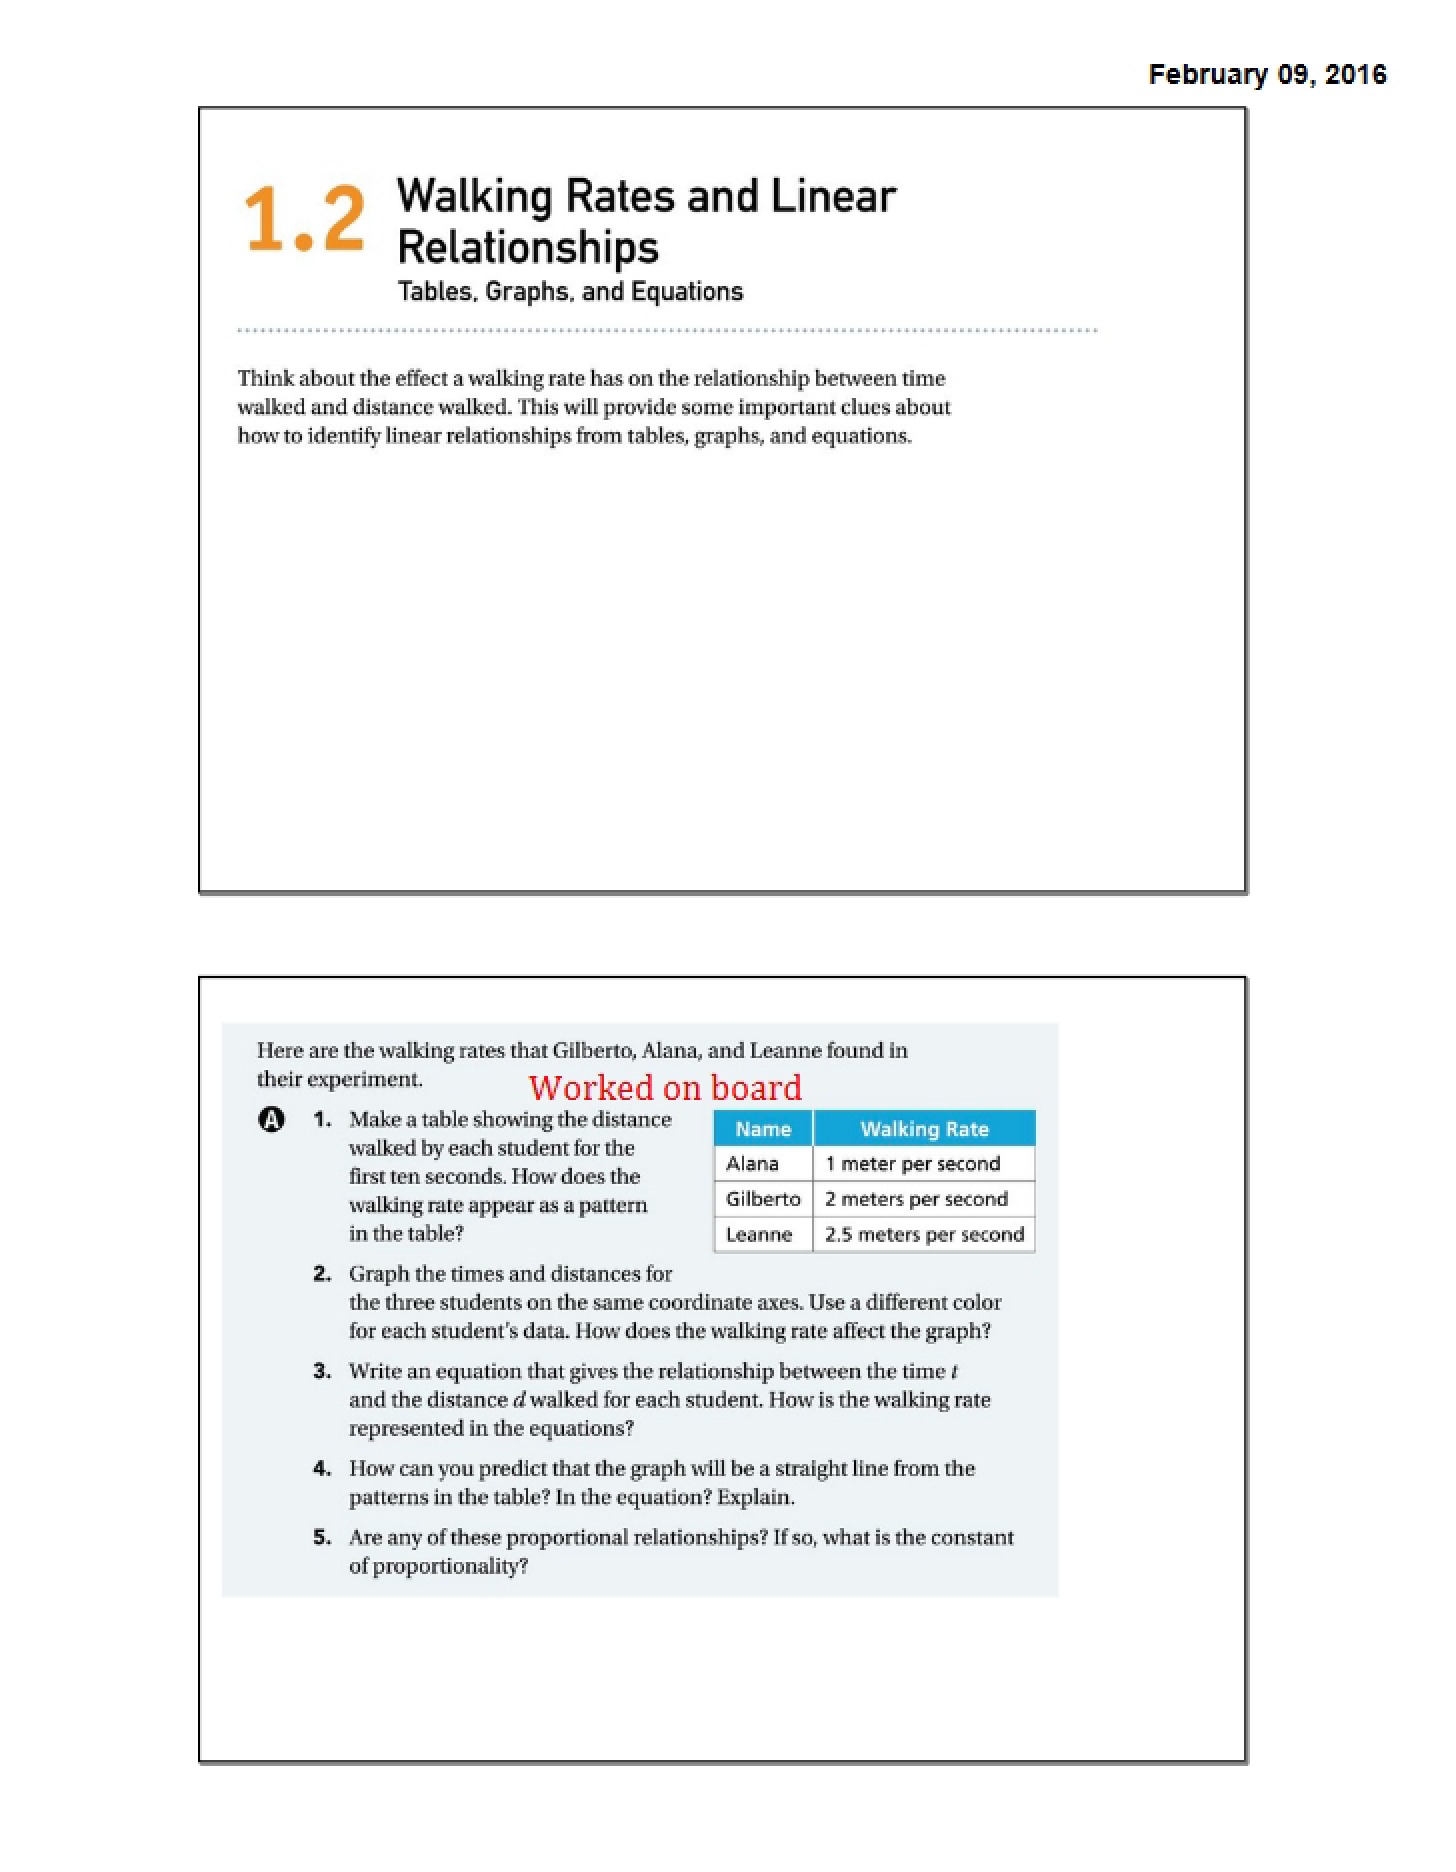
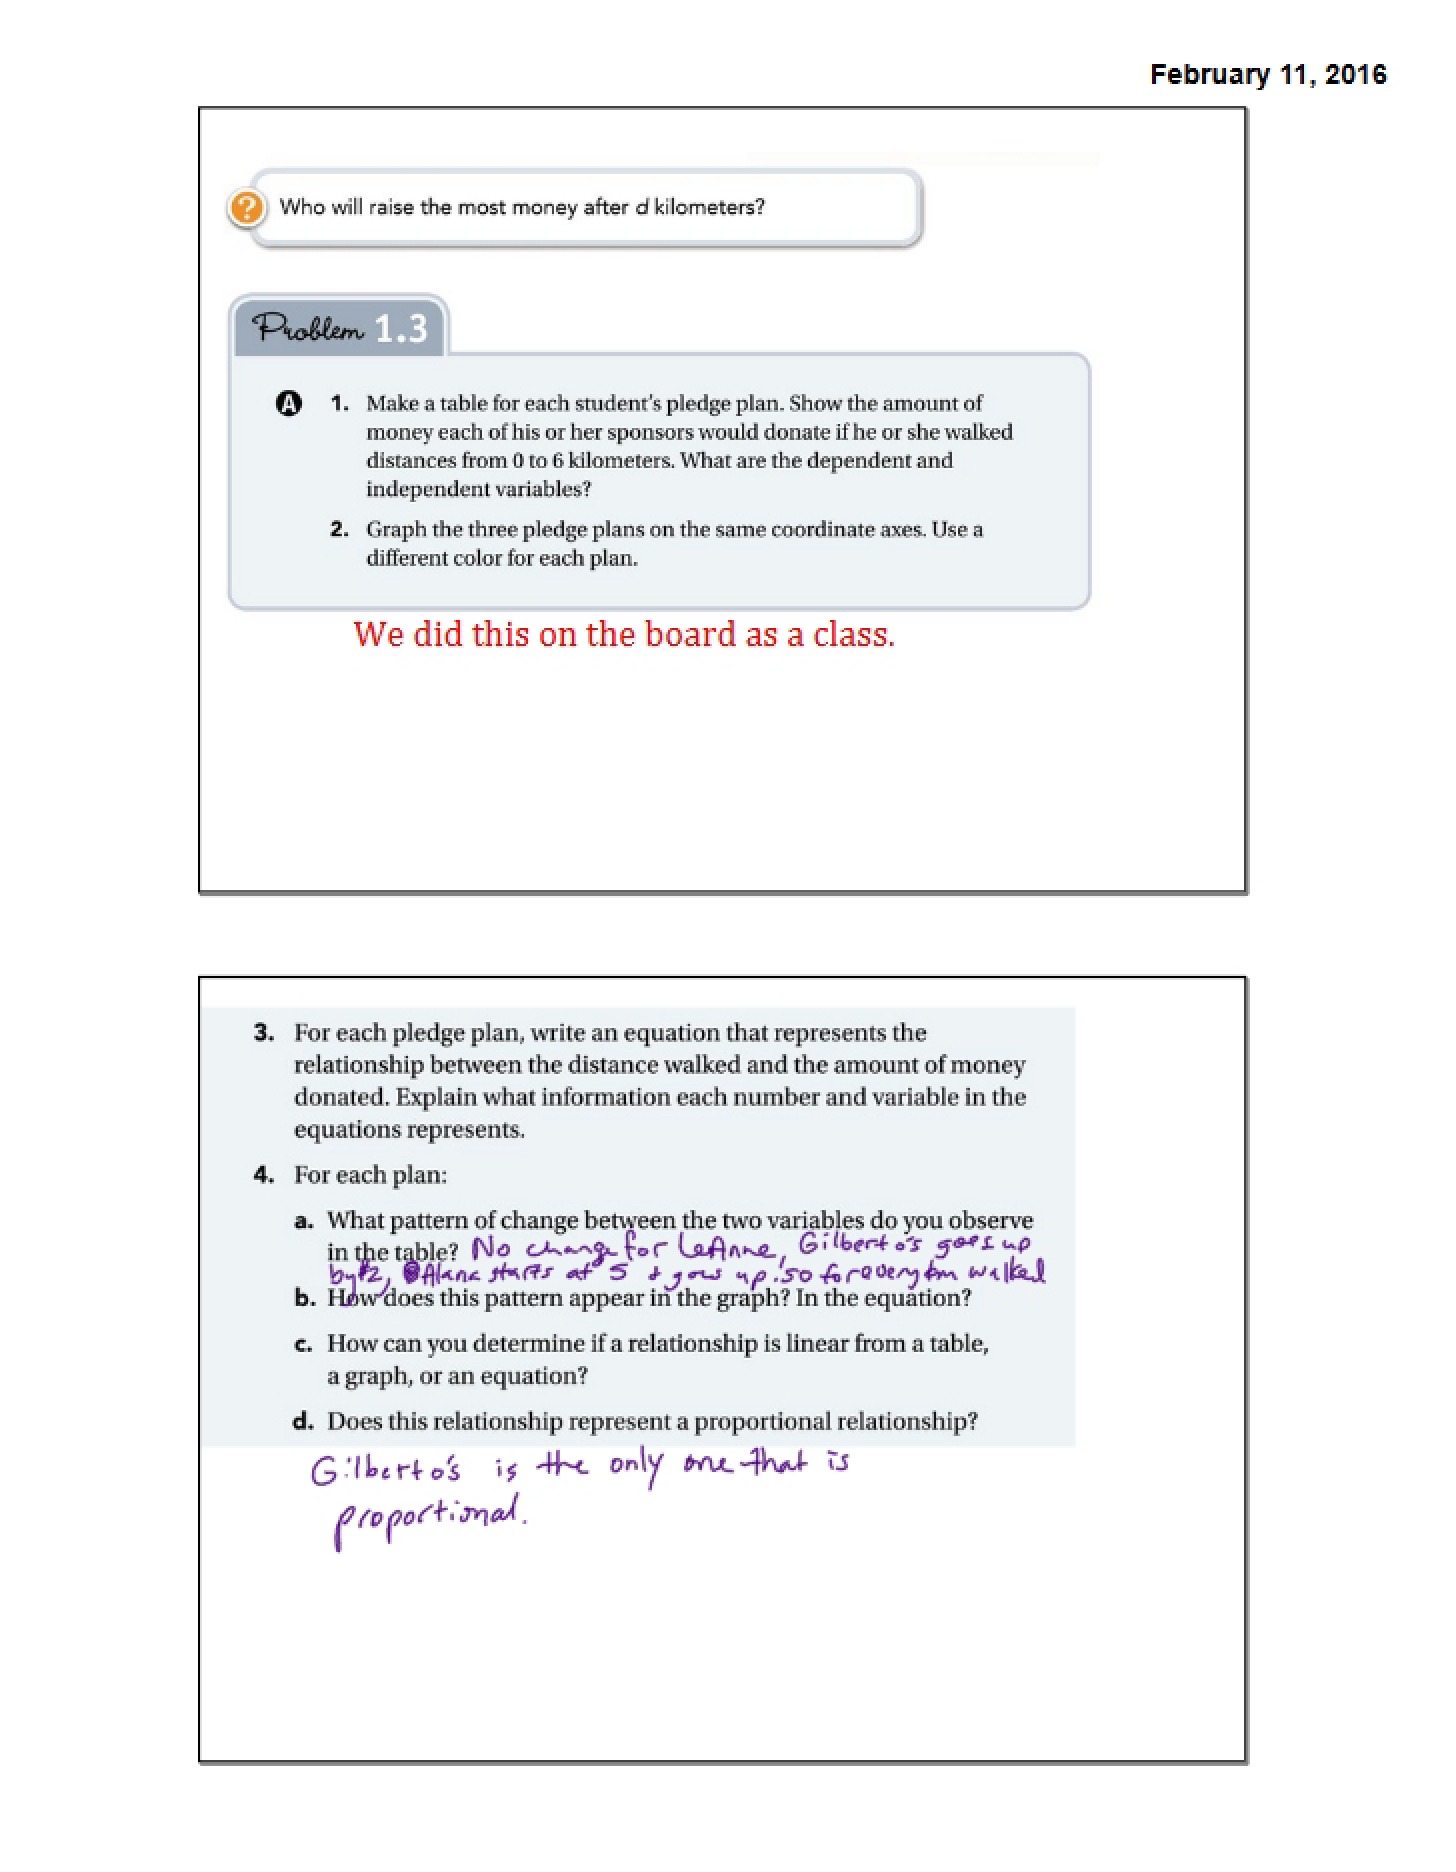
What This Document Is
This resource is designed to deepen your understanding of the interconnectedness between different methods of representing mathematical relationships. Specifically, it focuses on how tables, graphs, and equations relate to one another, offering a comprehensive exploration of this core concept in mathematics. It builds upon foundational knowledge of linear relationships and pledge plans as a practical application.
Why This Document Matters
This material is particularly beneficial for students in (COMM 1276) at UCLA who are looking to solidify their grasp of representing and interpreting data. It’s ideal for use when you’re working through problem sets involving proportional reasoning, or when preparing to translate between different data formats. If you find yourself struggling to visualize data presented in one form, or to convert between tables, graphs, and equations, this resource will provide valuable support.
Topics Covered
* Interpreting relationships represented by equations.
* Creating and analyzing tables of values.
* Sketching graphs from given equations and data.
* Identifying points on a graph and their corresponding values in tables and equations.
* Determining missing coordinates in data sets.
* Relating points on a graph to their representation in tables and equations.
* Using different representations to solve for unknown variables.
What This Document Provides
* Exploration of real-world scenarios, such as pledge plans, to illustrate the connections between tables, graphs, and equations.
* Opportunities to analyze multiple representations of the same relationship.
* A framework for understanding how to extract information from each representation.
* Exercises designed to strengthen your ability to translate between tables, graphs, and equations.
* A focus on interpreting the meaning of data points within the context of the problem.