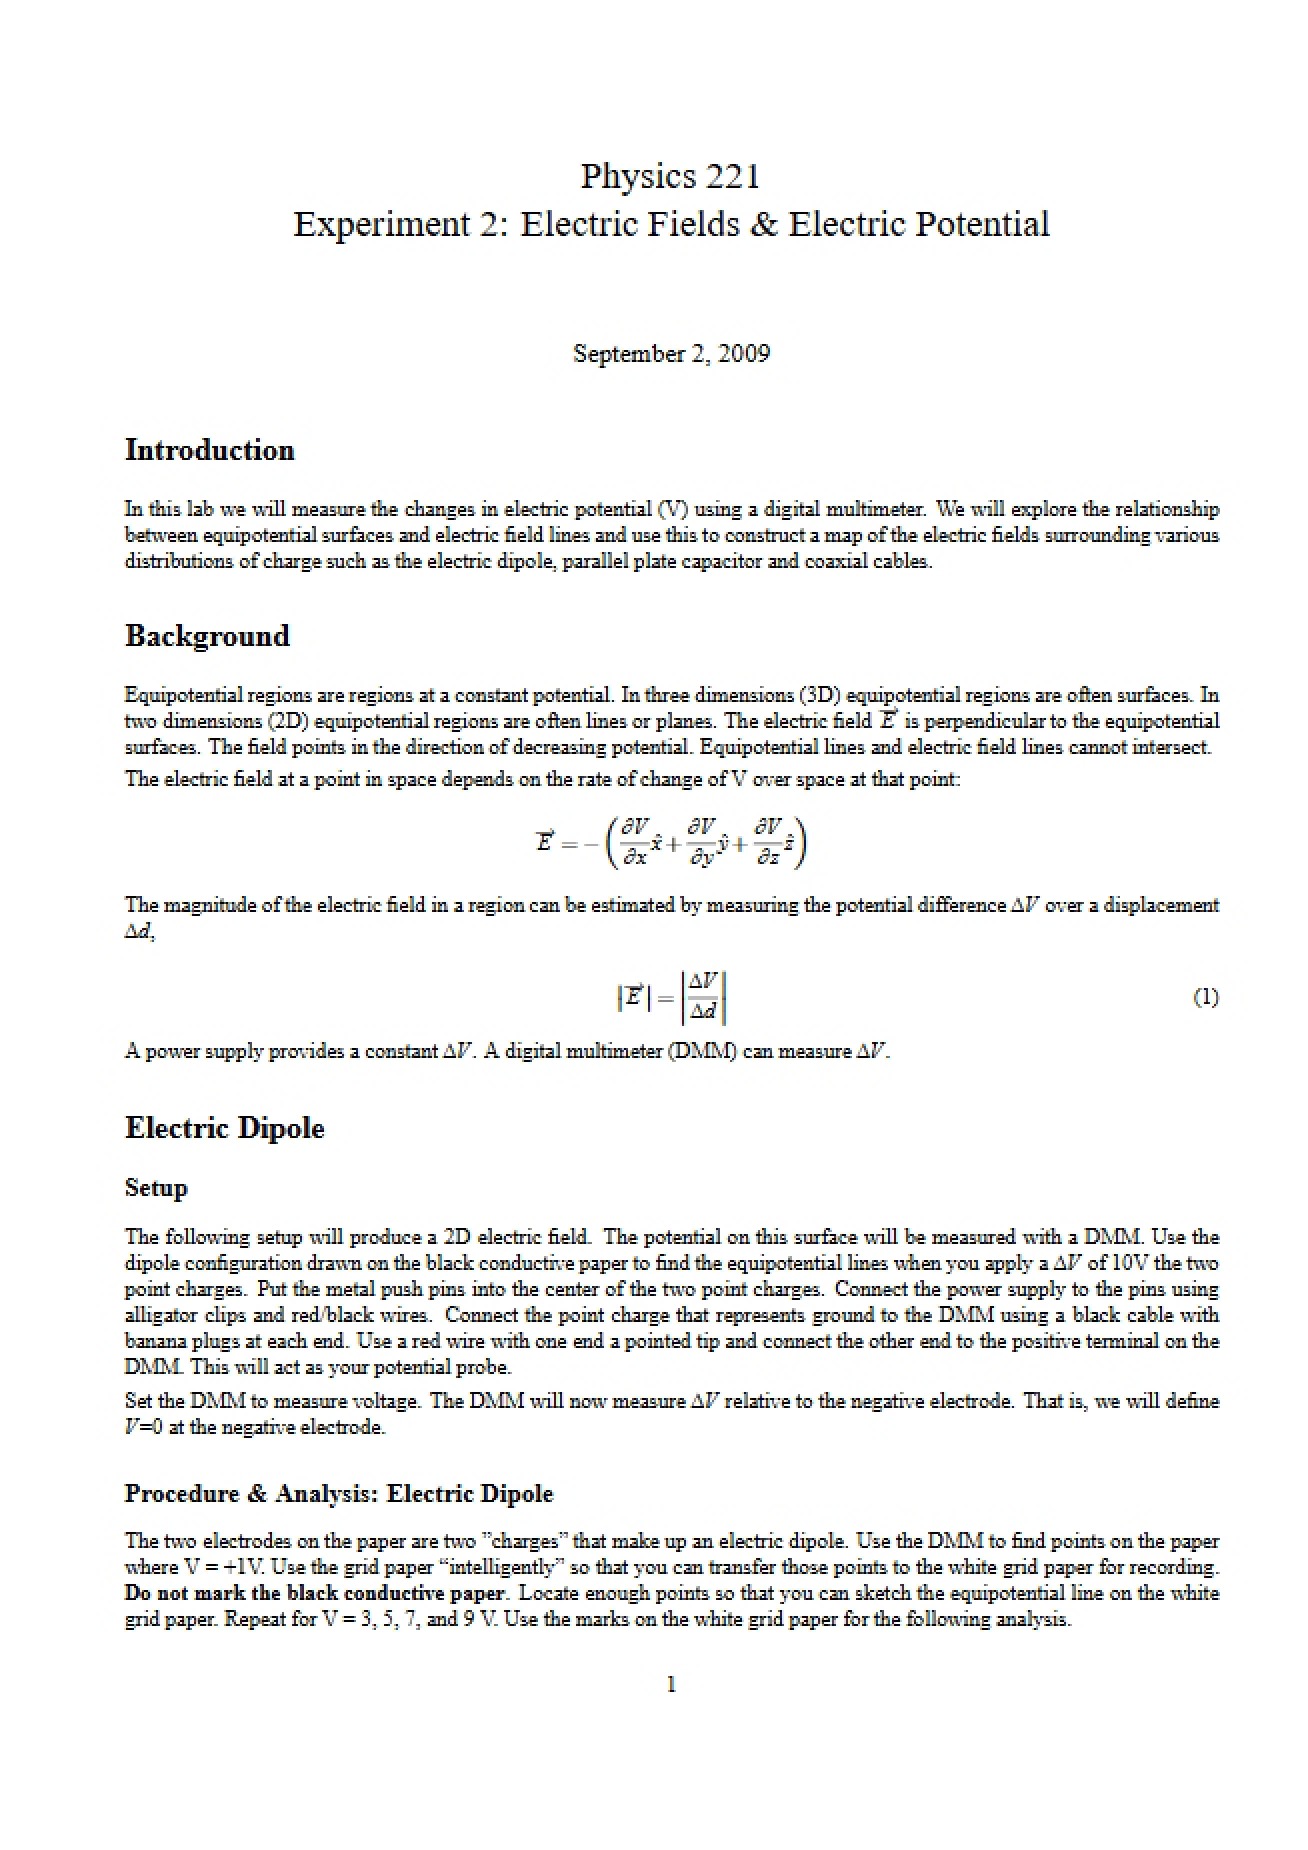
This document is a third lab report from Illinois Institute of Technology’s General Physics II: Electricity and Magnetism (PHYS 221) course, completed by SuGyeong Hong on February 12, 2020. It details an experiment focused on visualizing electric fields and electric potential.
This report is intended for the course instructor for grading purposes, demonstrating the student’s understanding of the relationship between equipotential lines and electric field lines. It’s a key component of assessing practical application of theoretical concepts covered in the course. Students completing this lab would have been working with conductive sheets, power supplies, and grid paper to map these fields.
This report does *not* provide a comprehensive explanation of electric field or potential theory. It assumes prior knowledge of Coulomb’s Law and related equations. It also doesn’t offer a generalized lab procedure; it presents the results of *one* student’s experiment.
The full report includes: an introduction to electric fields and potential, a description of the experimental methods used to create dipole and parallel line configurations, drawn equipotential lines and sketched electric field lines, answers to questions regarding field line behavior and the impact of voltage and conductor arrangement, and tables presenting electric field strength calculations at various locations on the conductive sheets. It also includes data tables (Tables 1-4) detailing field locations and magnitudes.