What This Document Is
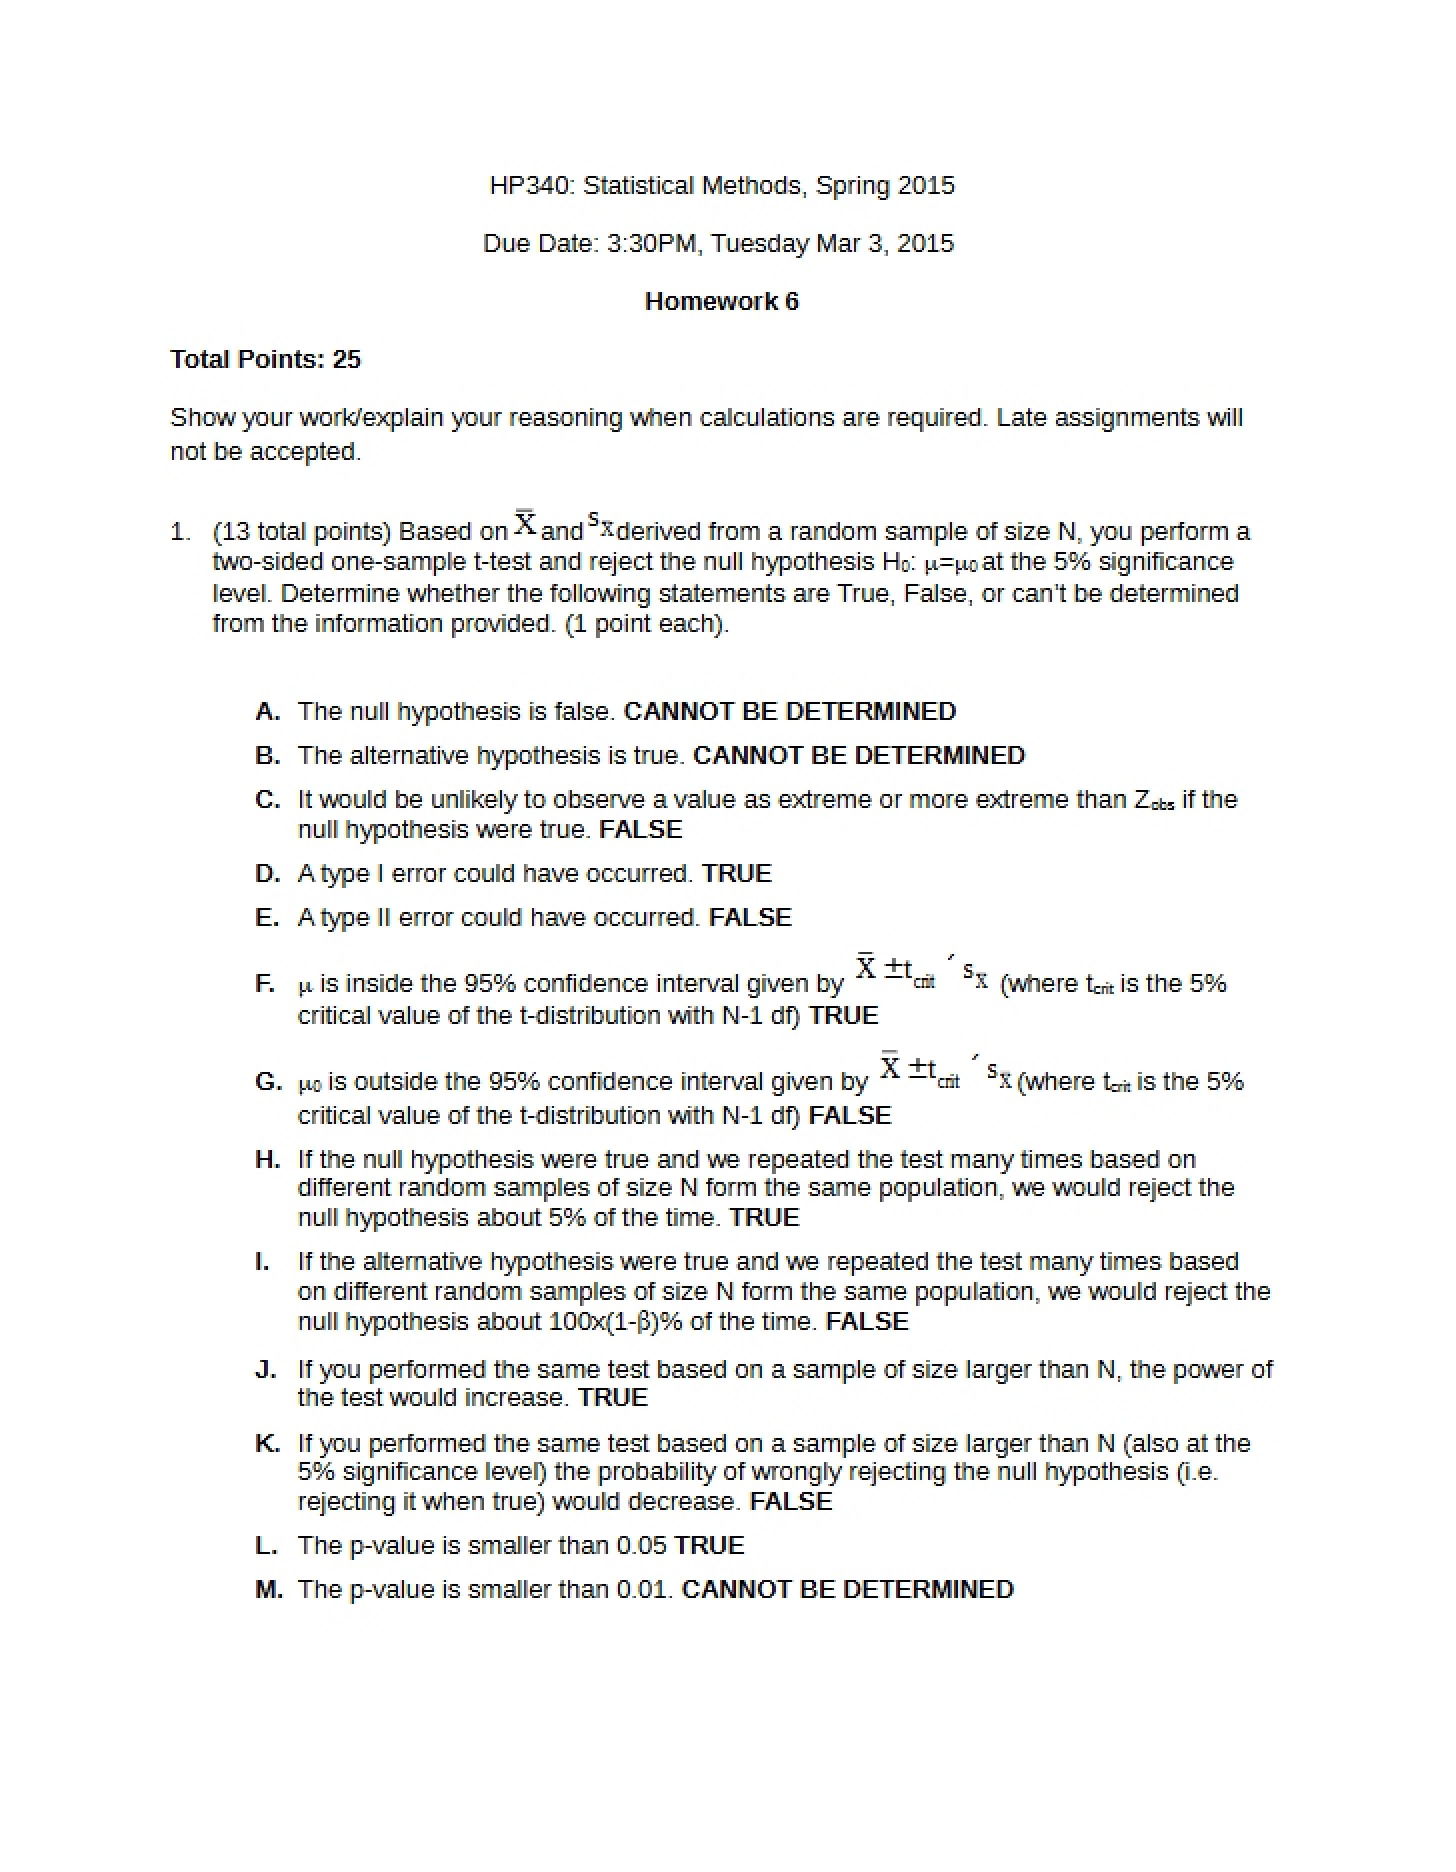
This is a homework assignment for Health Behavior Statistical Methods (HP 340) at the University of Southern California, specifically Homework 5 from Spring 2015. It’s designed to assess your understanding of fundamental statistical concepts, particularly those related to sampling distributions and descriptive statistics. The assignment focuses on applying theoretical knowledge to practical exercises involving data analysis and interpretation. It requires both computational work and conceptual explanations.
Why This Document Matters
This assignment is crucial for students enrolled in HP 340, or similar courses focusing on statistical applications in public health and health behavior. Successfully completing this homework will reinforce your ability to work with data, calculate key statistical measures, and understand the implications of sampling variability. It’s particularly valuable when you’re learning to bridge the gap between statistical theory and real-world data analysis scenarios. It’s best used as a practice tool *after* reviewing relevant course materials and lectures, and before attempting more complex analyses.
Common Limitations or Challenges
This assignment focuses on specific statistical techniques and doesn’t cover the entirety of statistical methods used in health behavior research. It’s designed to build a foundation, but won’t provide comprehensive coverage of all statistical tests or advanced modeling techniques. Furthermore, while the assignment provides a structured learning experience, it requires independent problem-solving and a solid grasp of the underlying statistical principles – it won’t walk you through every step. Access to statistical software is not explicitly required, but may be helpful for verifying calculations.
What This Document Provides
* A set of problems designed to test your understanding of sampling distributions.
* Exercises involving the calculation of sample means from a defined population.
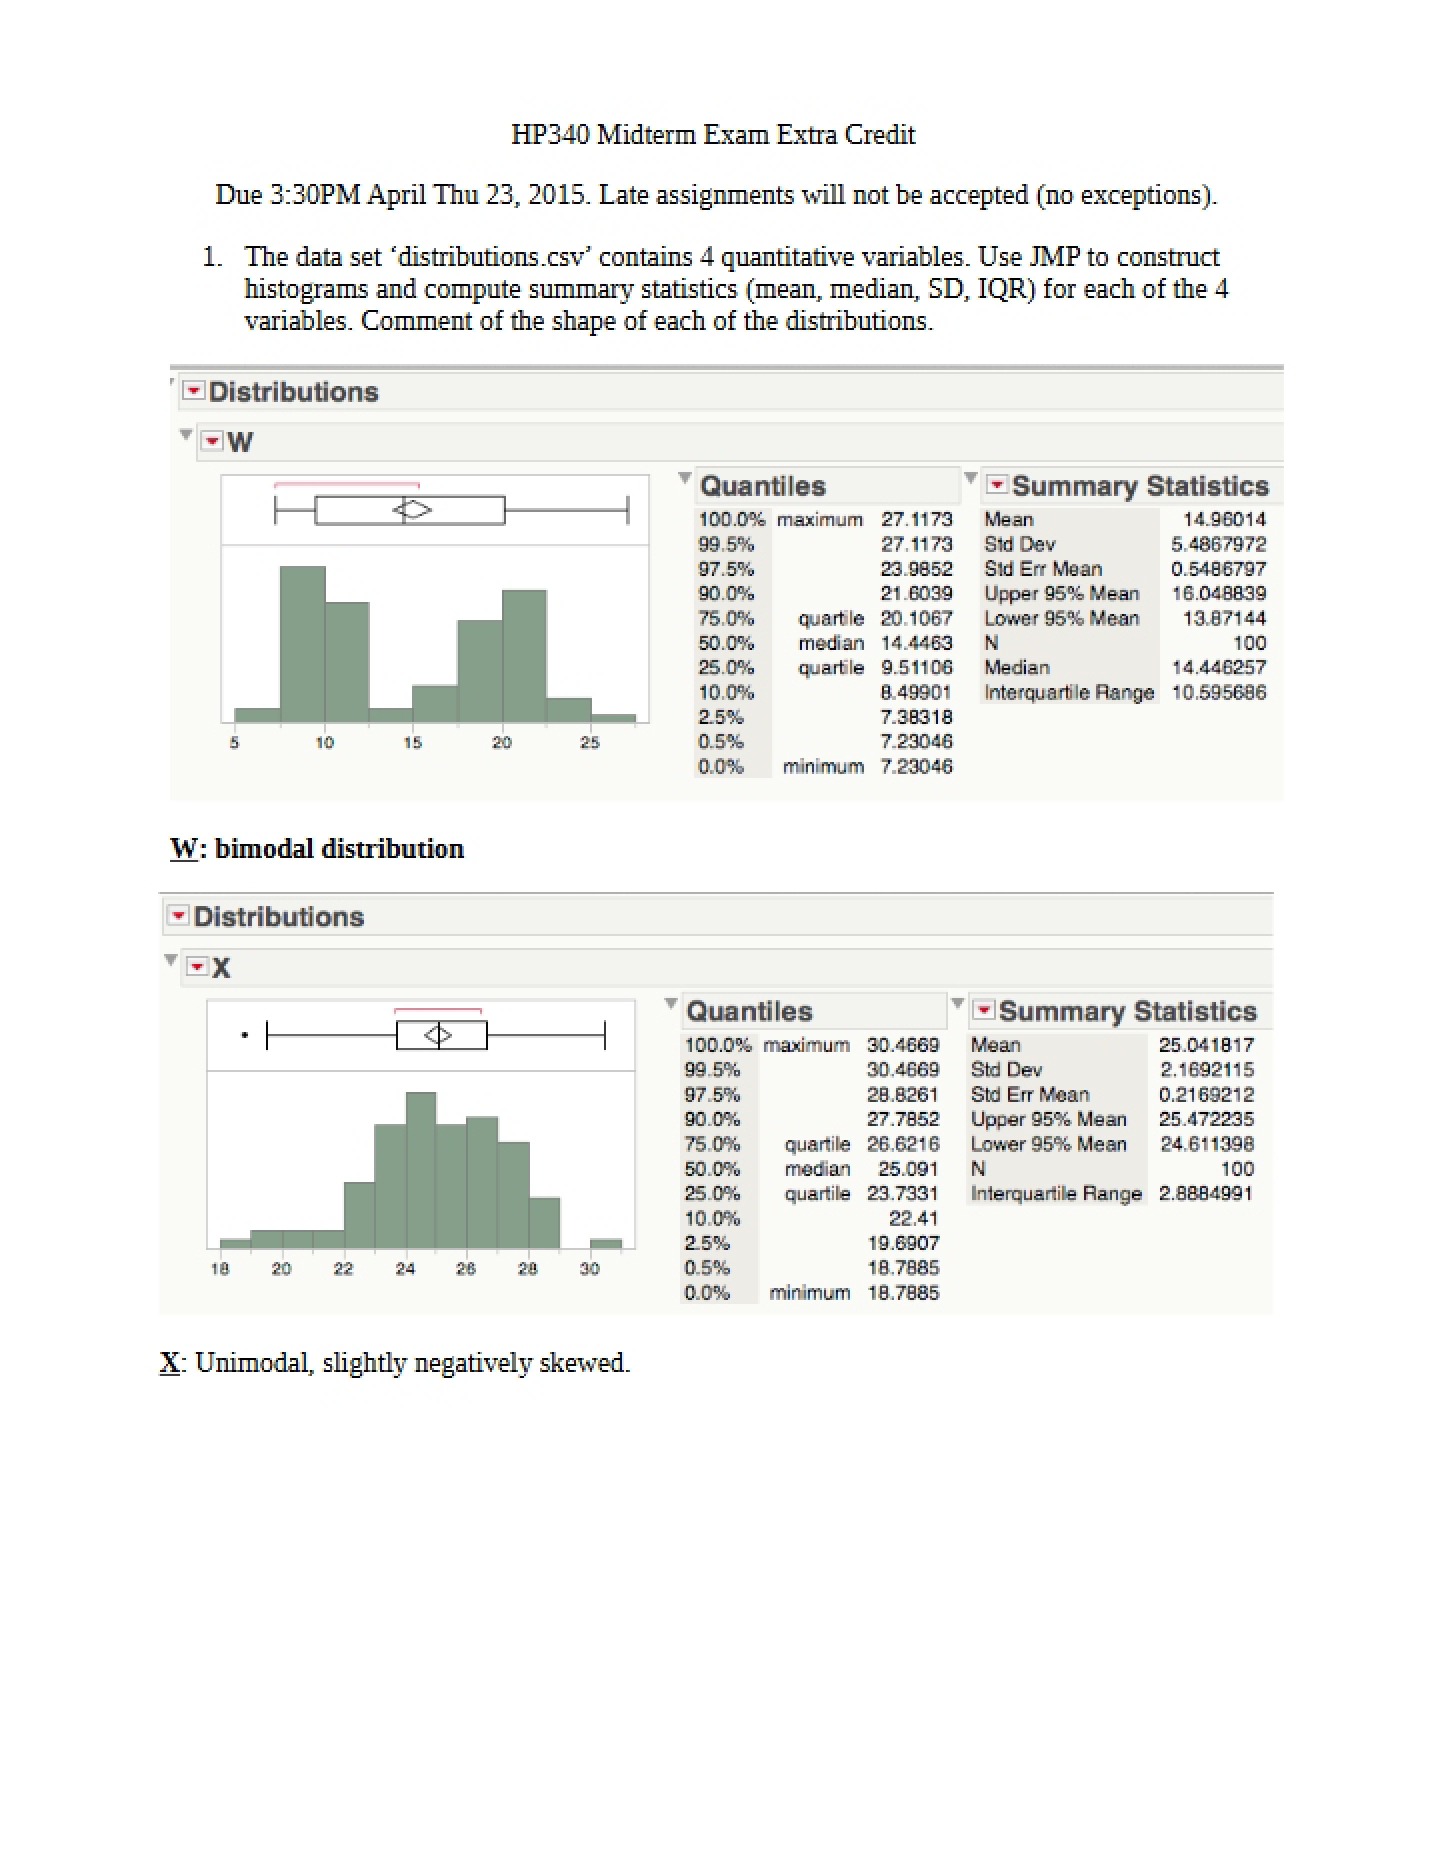
* Tasks requiring the creation of frequency distributions and histograms.
* Opportunities to compare population parameters with those derived from samples.
* A framework for interpreting the relationship between sample statistics and population characteristics.
* A point value breakdown for each question, totaling 55 points.