What This Document Is
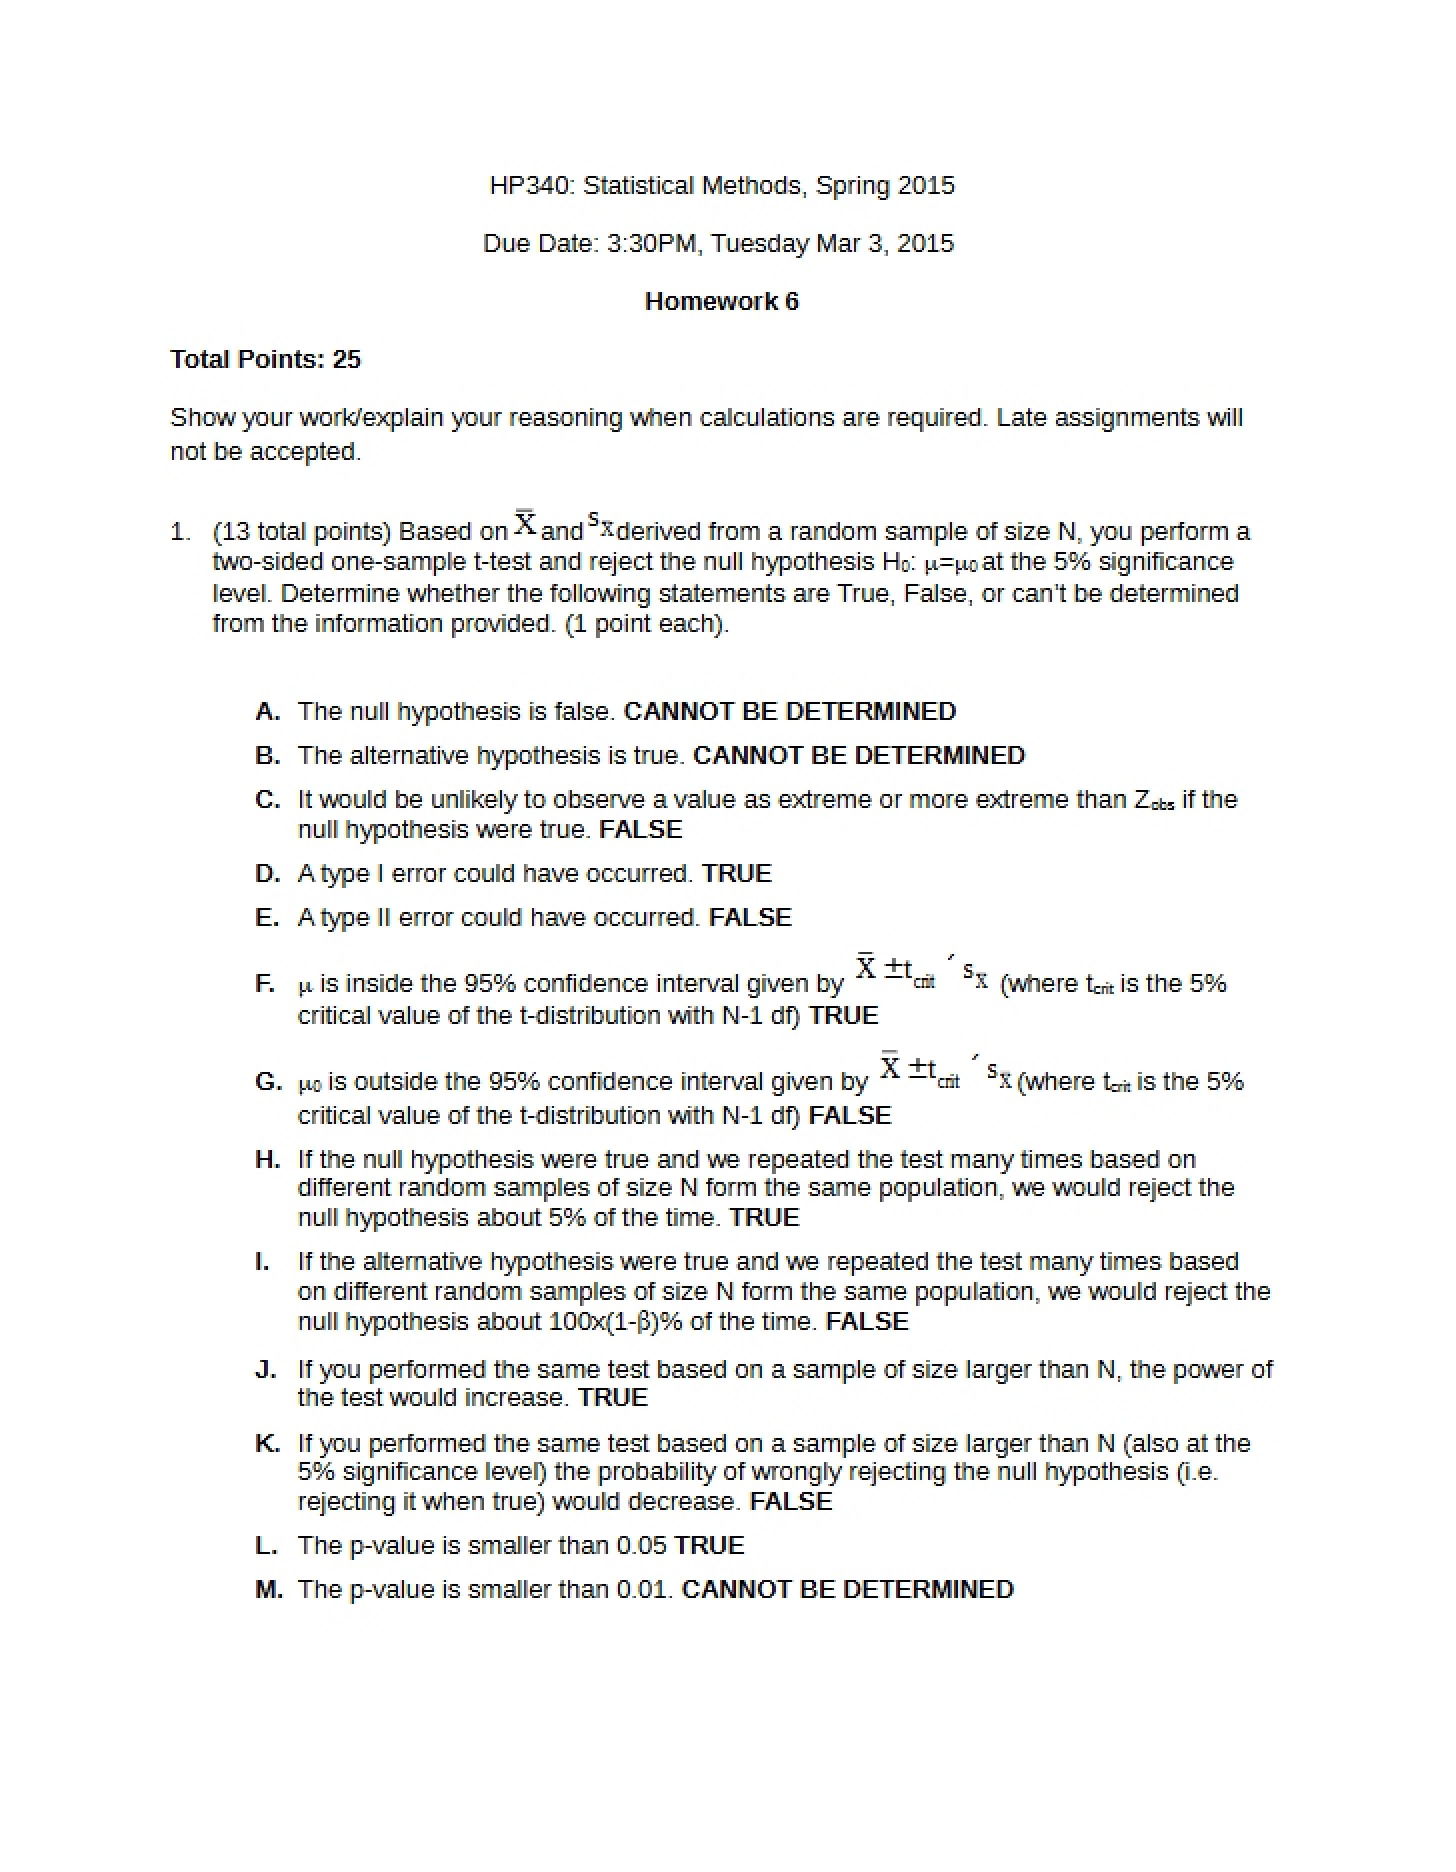
This document comprises lecture notes from HP 340L: Health Behavior Statistical Methods at the University of Southern California, specifically from a Fall 2017 session (Lecture Three). It focuses on foundational concepts in descriptive statistics – the methods used to summarize and present data in a meaningful way. The lecture builds upon previous discussions regarding the scientific method, data types, and scales of measurement. It serves as a core component of understanding how to prepare data for more advanced statistical analysis within the field of health behavior.
Why This Document Matters
Students enrolled in health behavior or public health statistics courses will find these notes particularly valuable. It’s ideal for reviewing key concepts *before* an exam, clarifying points discussed in class, or as a reference while working on assignments involving data description. Researchers and practitioners needing a refresher on fundamental statistical principles will also benefit. Understanding these concepts is crucial for interpreting research findings and conducting sound statistical analyses in health-related fields. This material is most helpful when used in conjunction with the course textbook and other assigned readings.
Common Limitations or Challenges
These lecture notes are a *supplement* to the course material, not a replacement for active class participation or the required textbook. They provide an overview of topics but do not include detailed step-by-step instructions for performing calculations or using statistical software. The notes also assume a basic understanding of research methodology and data types covered in prior lectures. They do not offer practice problems or solutions, and are specific to the instructor’s approach in Fall 2017.
What This Document Provides
* An overview of methods for graphically representing different types of variables (qualitative and quantitative).
* Discussion of various chart types, including bar graphs, pie charts, histograms, and frequency polygons.
* Explanation of frequency distributions – both grouped and ungrouped.
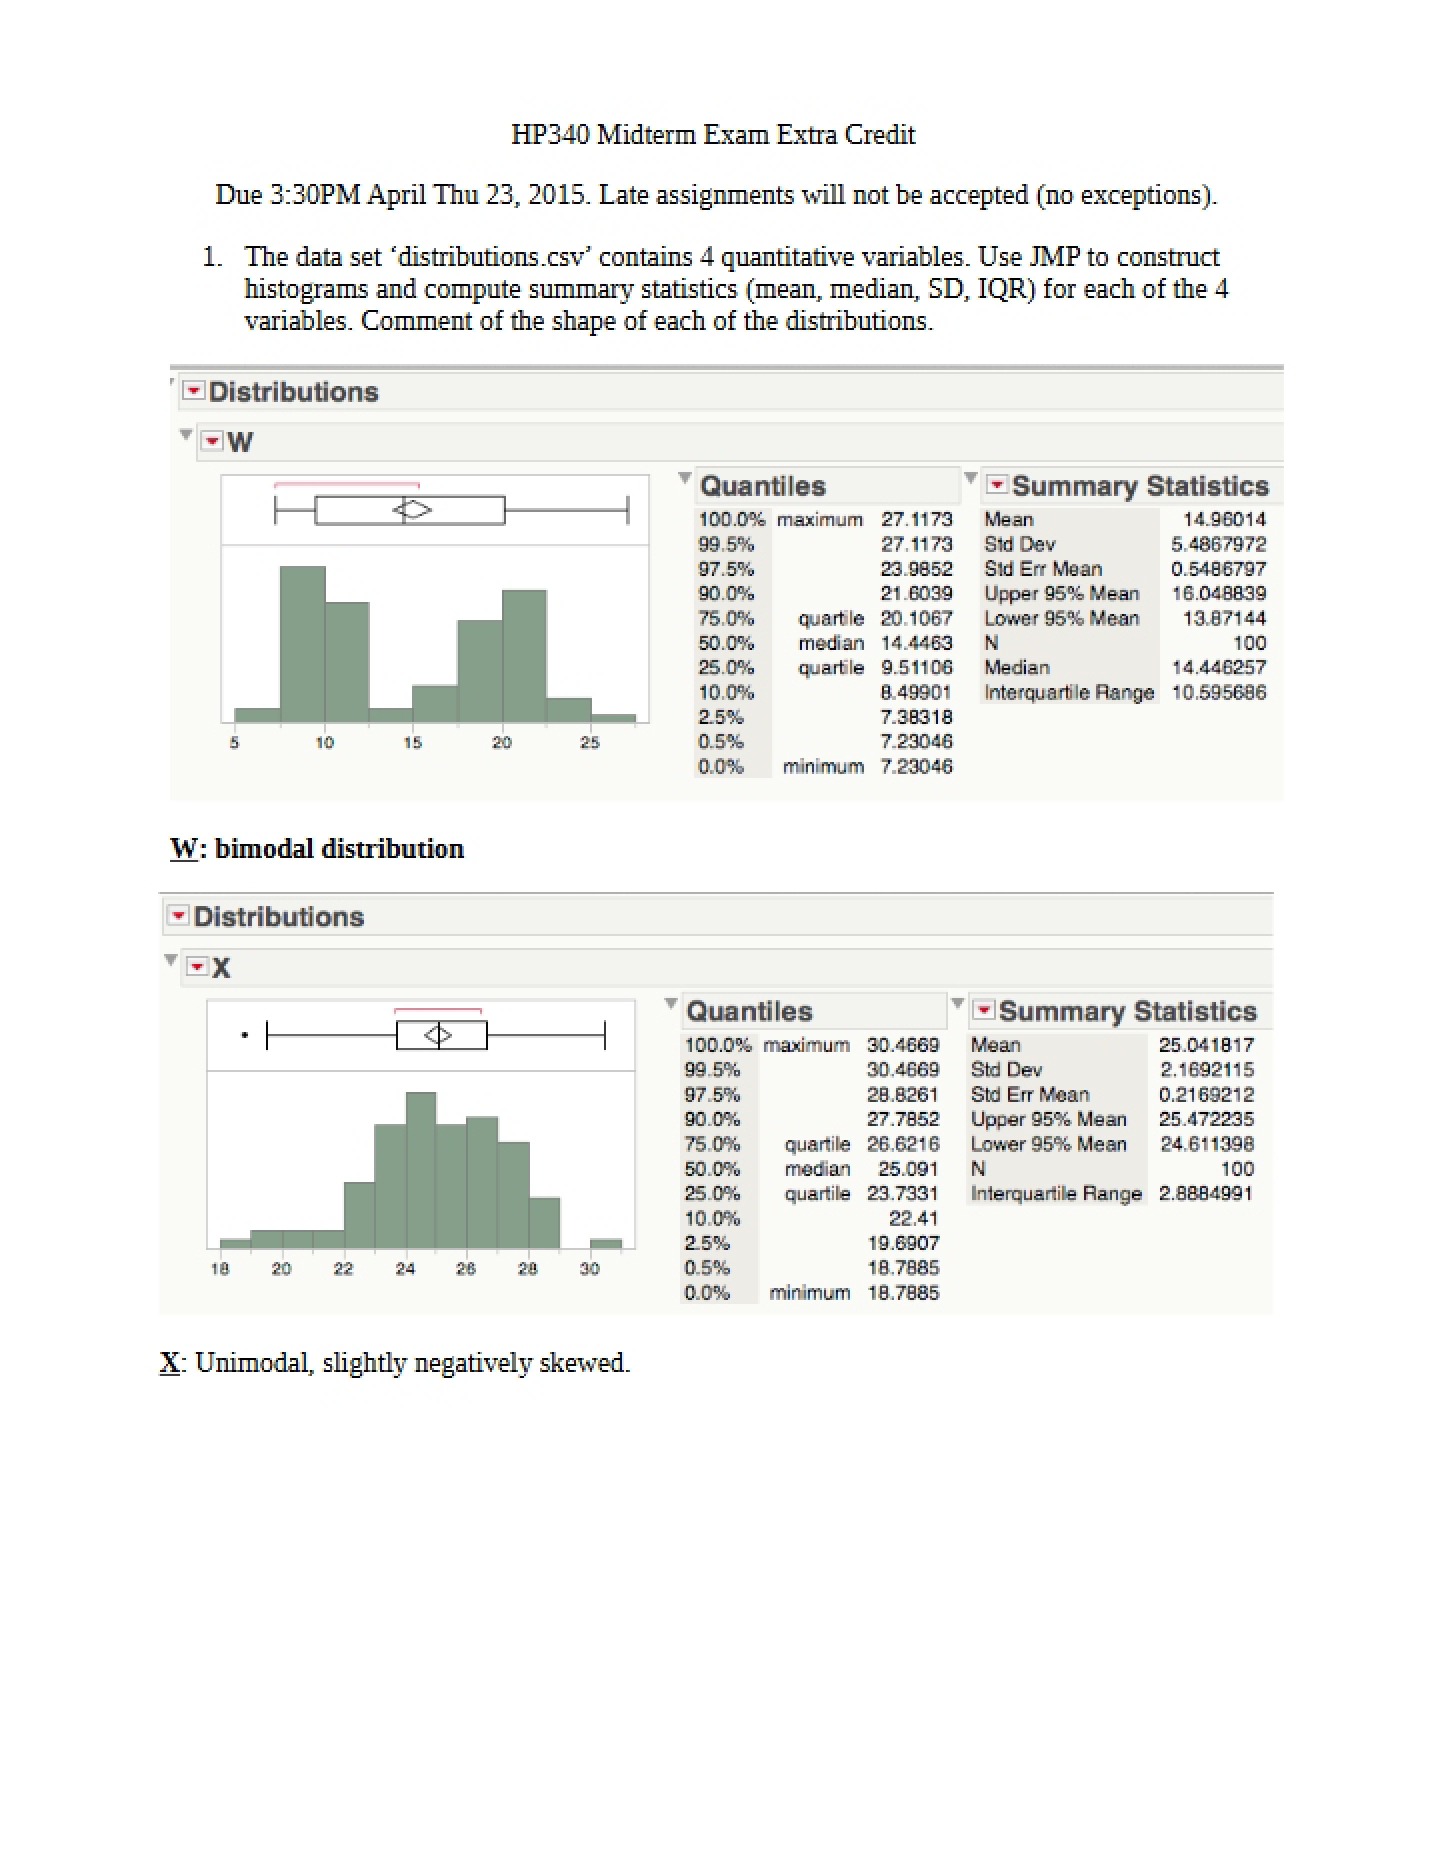
* Introduction to concepts related to understanding the shape of data distributions, including symmetry, normality, skewness, and modality.
* Exploration of percentile ranks and percentiles as descriptive measures.
* Brief mention of utilizing statistical software (SPSS) for chart creation.