What This Document Is
This is a completed assignment for STAT 1000Q, Intro to Stats at the University of Connecticut, specifically focusing on practical application using Minitab statistical software. It demonstrates a student’s ability to analyze datasets and interpret statistical outputs related to descriptive statistics and data visualization. The assignment centers around applying statistical techniques to real-world scenarios, likely involving exam scores and performance spreads.
Why This Document Matters
This resource is ideal for students currently enrolled in STAT 1000Q seeking to understand how course concepts translate into graded assignments. It’s particularly helpful for students who want to see a worked example to clarify expectations, understand the level of detail required, or review how to present statistical findings. Reviewing a completed assignment can be a valuable step in preparing for your own submissions and solidifying your understanding *before* tackling the assignment yourself. It’s best used *after* attempting the assignment independently, to compare approaches and identify areas for improvement.
Topics Covered
* Descriptive Statistics (measures of central tendency and dispersion)
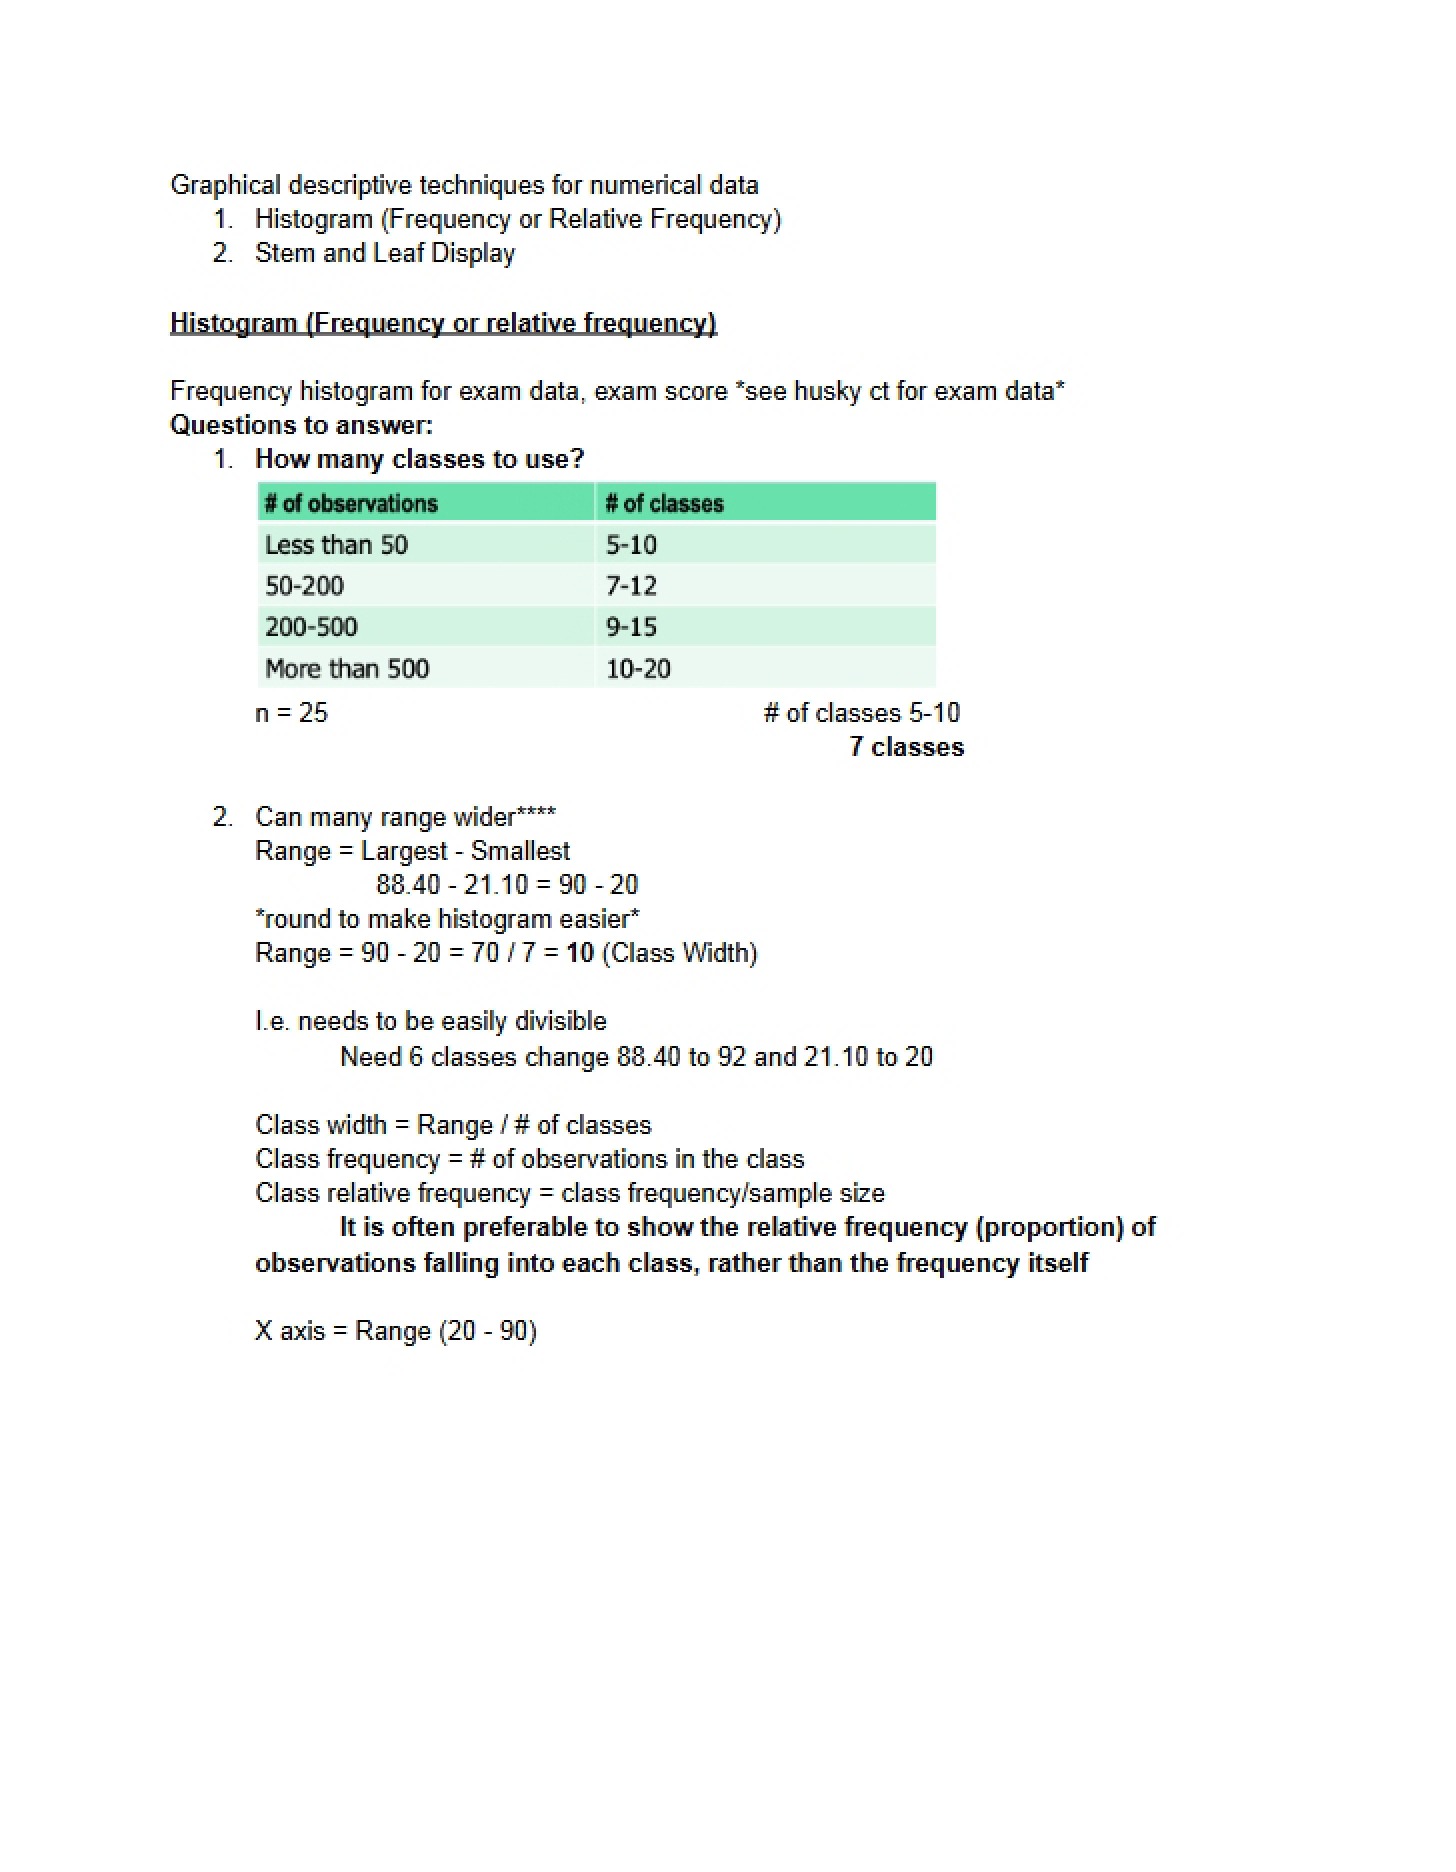
* Data Visualization (stem-and-leaf plots, boxplots)
* Interpretation of Statistical Output
* Quartiles and Interquartile Range (IQR)
* Data Range and Distribution Analysis
* Minitab Software Application
What This Document Provides
* A completed assignment submission for STAT 1000Q.
* Illustrative examples of statistical analysis applied to datasets.
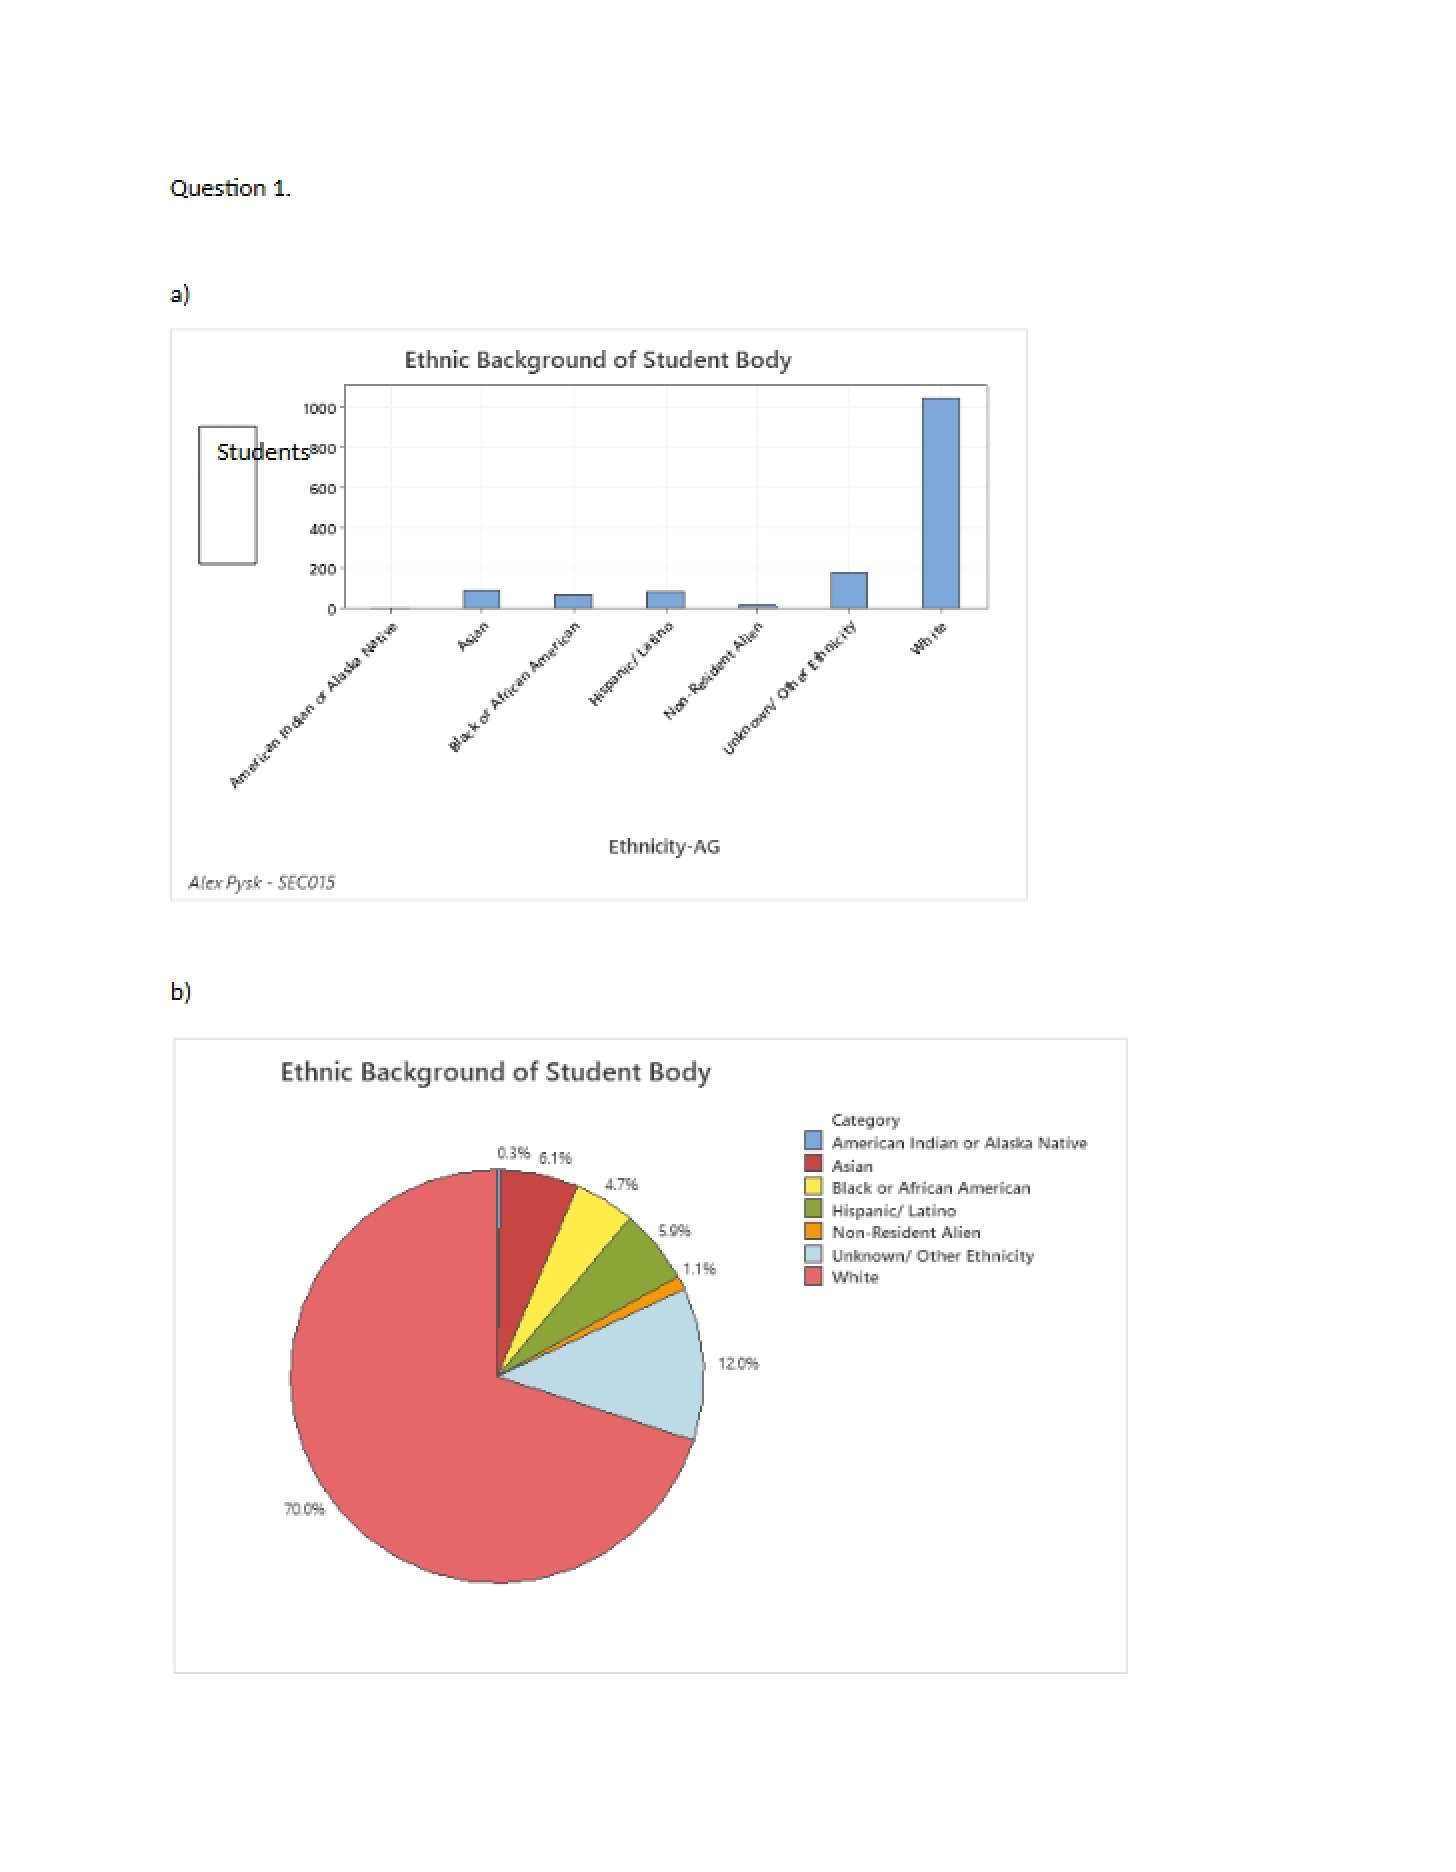
* Visual representations of data using common statistical plots.
* Demonstration of how to summarize and interpret key statistical values.
* An example of how to present statistical findings in a structured format.
* Analysis of data related to performance metrics and spreads.