What This Document Is
This resource is a focused exploration of factorial treatment structures within the field of experimental design. It delves into how researchers systematically manipulate multiple factors (independent variables) simultaneously to understand their individual and combined effects on a response variable. The material utilizes real-world datasets and statistical software output to illustrate key concepts. It’s geared towards students learning to plan and analyze experiments with more than one manipulated variable.
Why This Document Matters
Students enrolled in courses like Designing Experiments (STAT 5303) – or similar statistics and research methods courses – will find this particularly valuable. It’s ideal for those grappling with understanding how to set up experiments involving multiple factors, and how to interpret the results when interactions between those factors are suspected. Researchers needing a refresher on factorial designs before conducting their own studies will also benefit. This resource bridges the gap between theoretical understanding and practical application of these designs.
Common Limitations or Challenges
This material focuses specifically on the *structure* of factorial experiments and initial data exploration. It does not provide a comprehensive guide to all possible statistical analyses that can be performed on factorial data, such as detailed ANOVA tables or post-hoc tests. It also assumes a foundational understanding of statistical concepts like means, variances, and basic plotting techniques. The resource presents examples using a specific statistical package; while the concepts are broadly applicable, the exact syntax will vary depending on the software used.
What This Document Provides
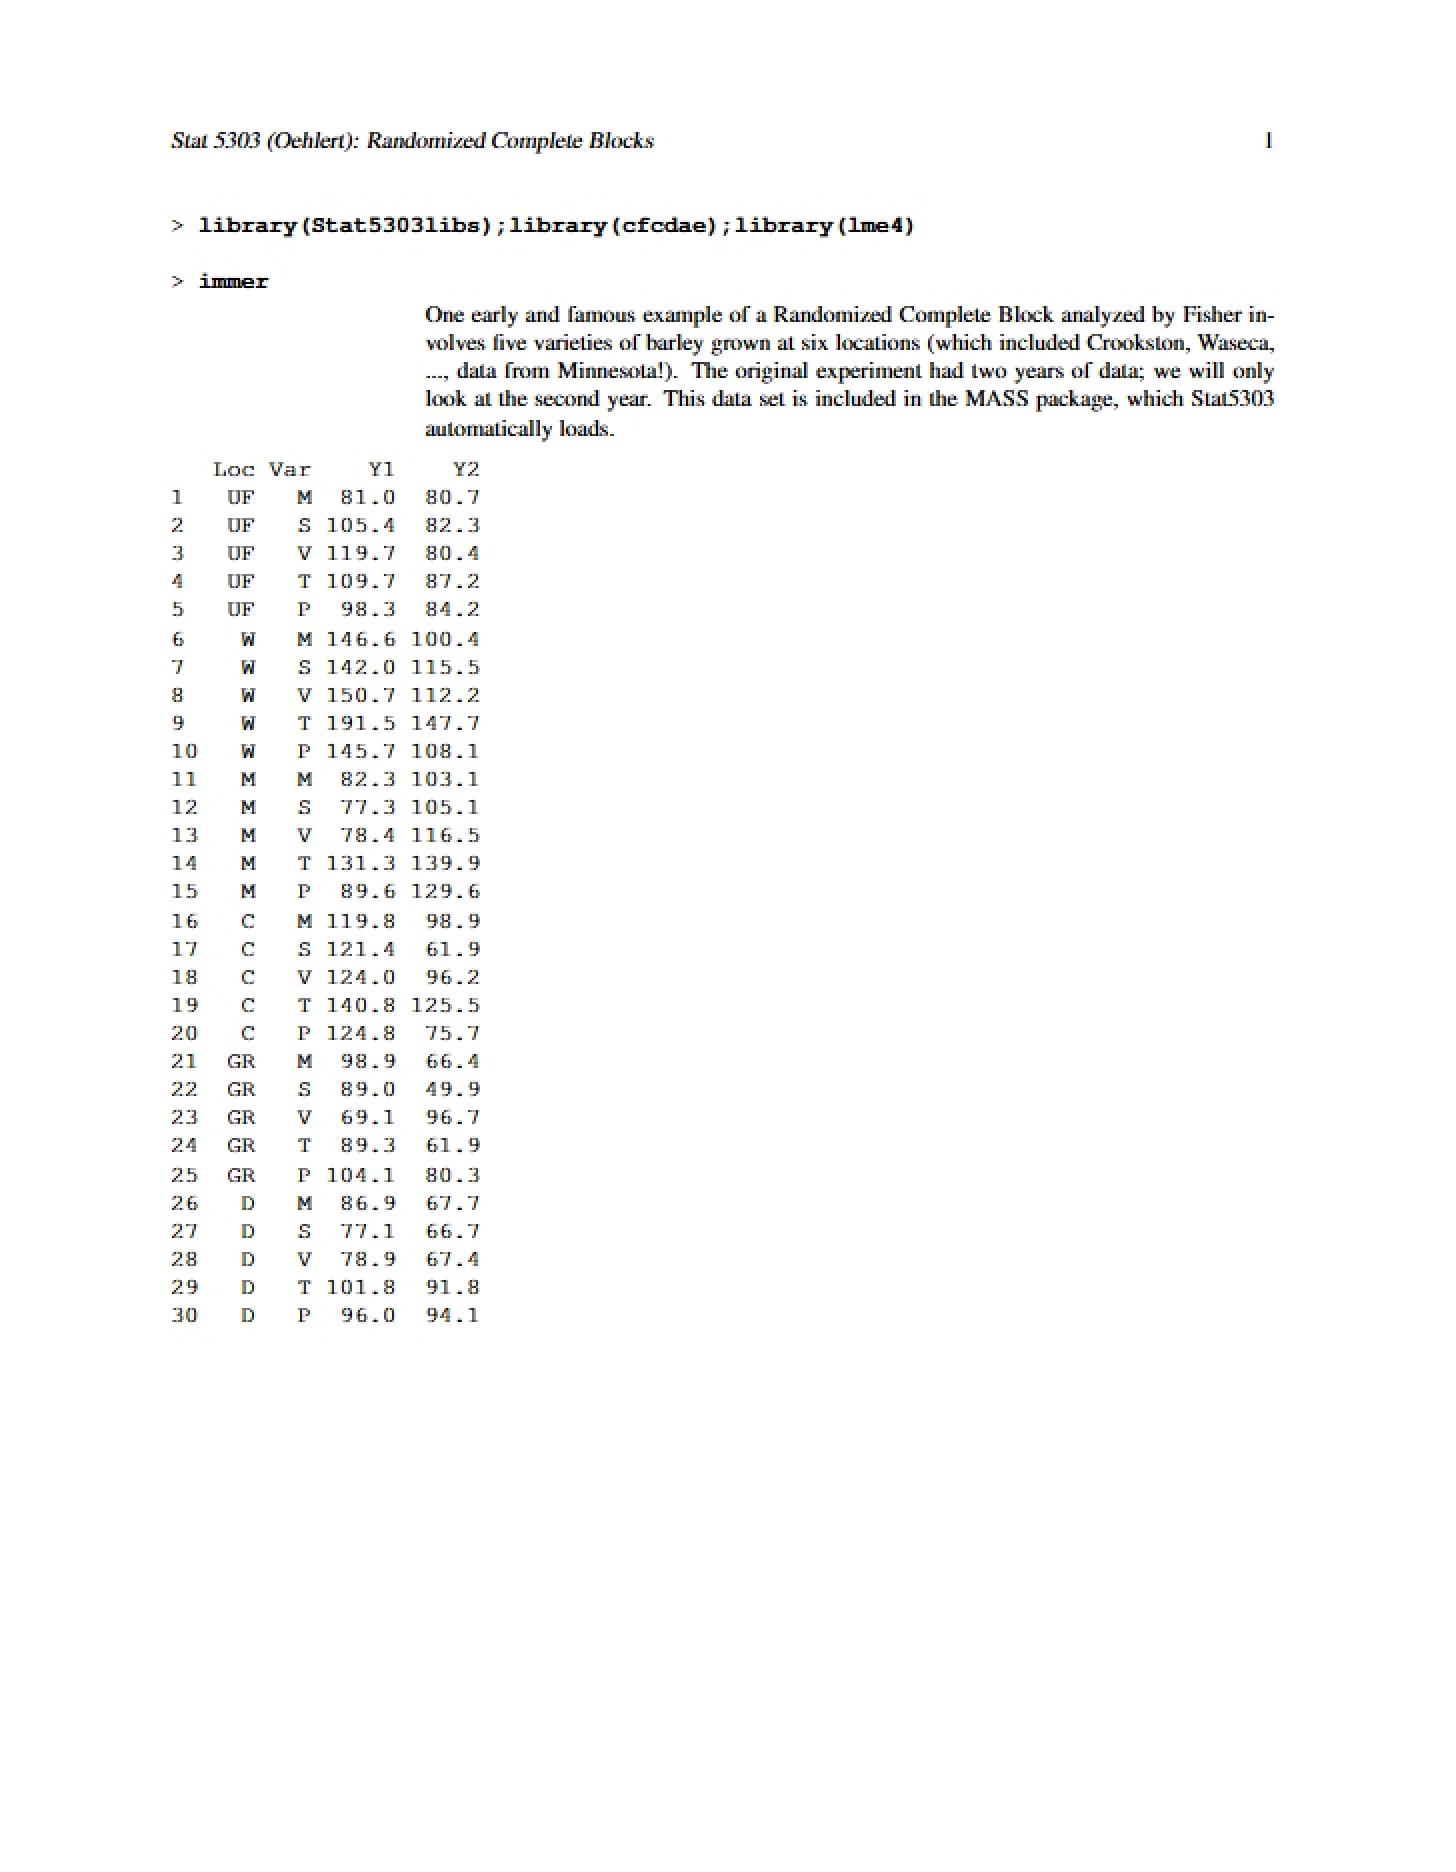
* Illustrative datasets used to demonstrate factorial designs.
* Discussion of how to visualize relationships between factors and responses.
* Explanation of how different arrangements of factors in a design can affect interpretation.
* Exploration of the concept of interactions between factors.
* Consideration of how confidence intervals can aid in interpreting observed effects.
* Examples of how to use statistical software to create interaction plots.