What This Document Is
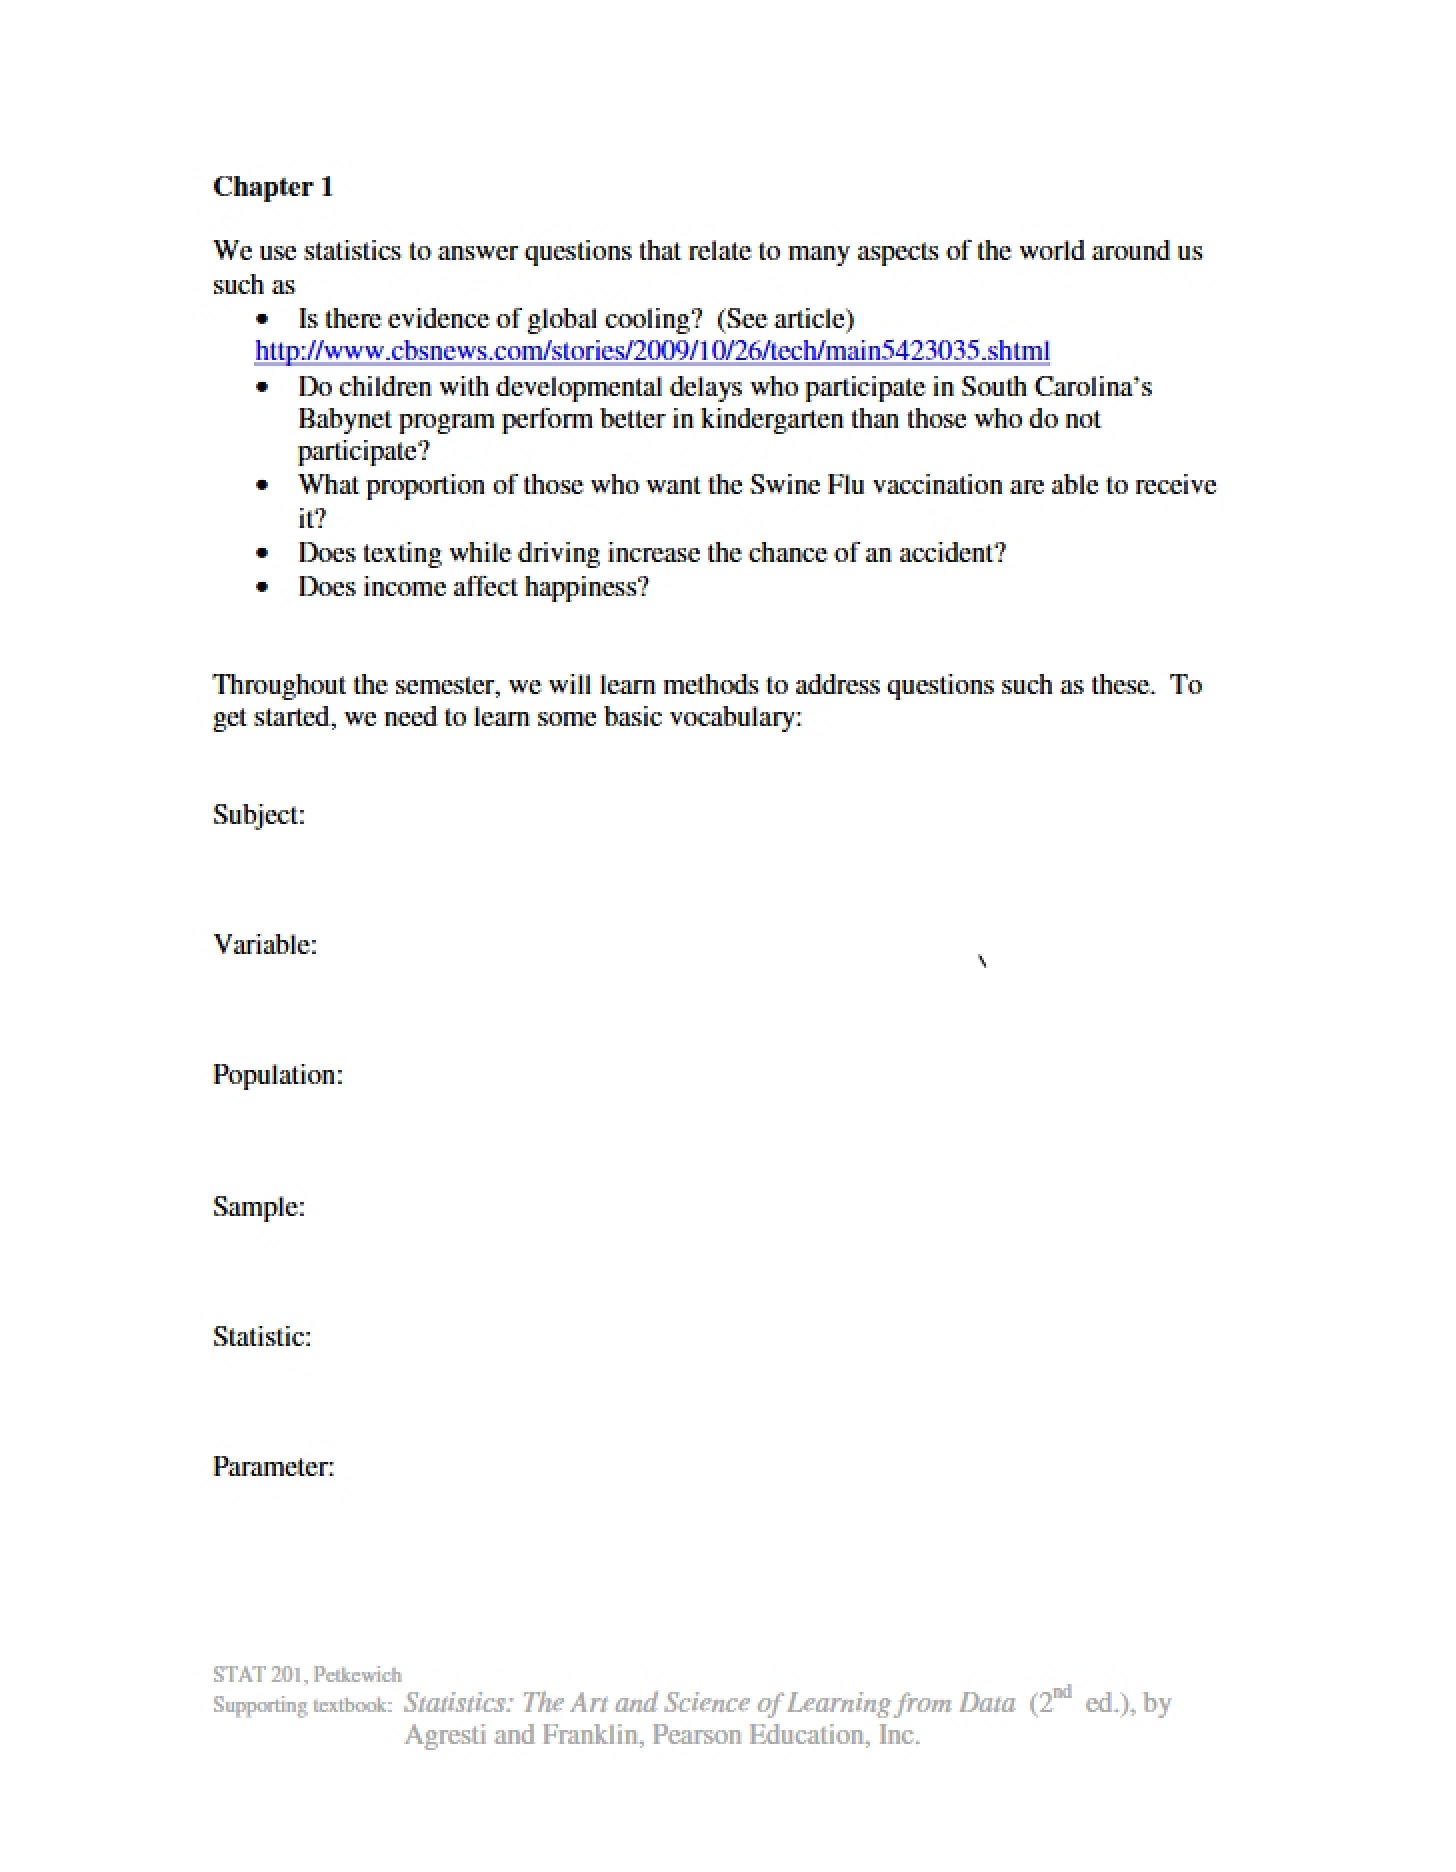
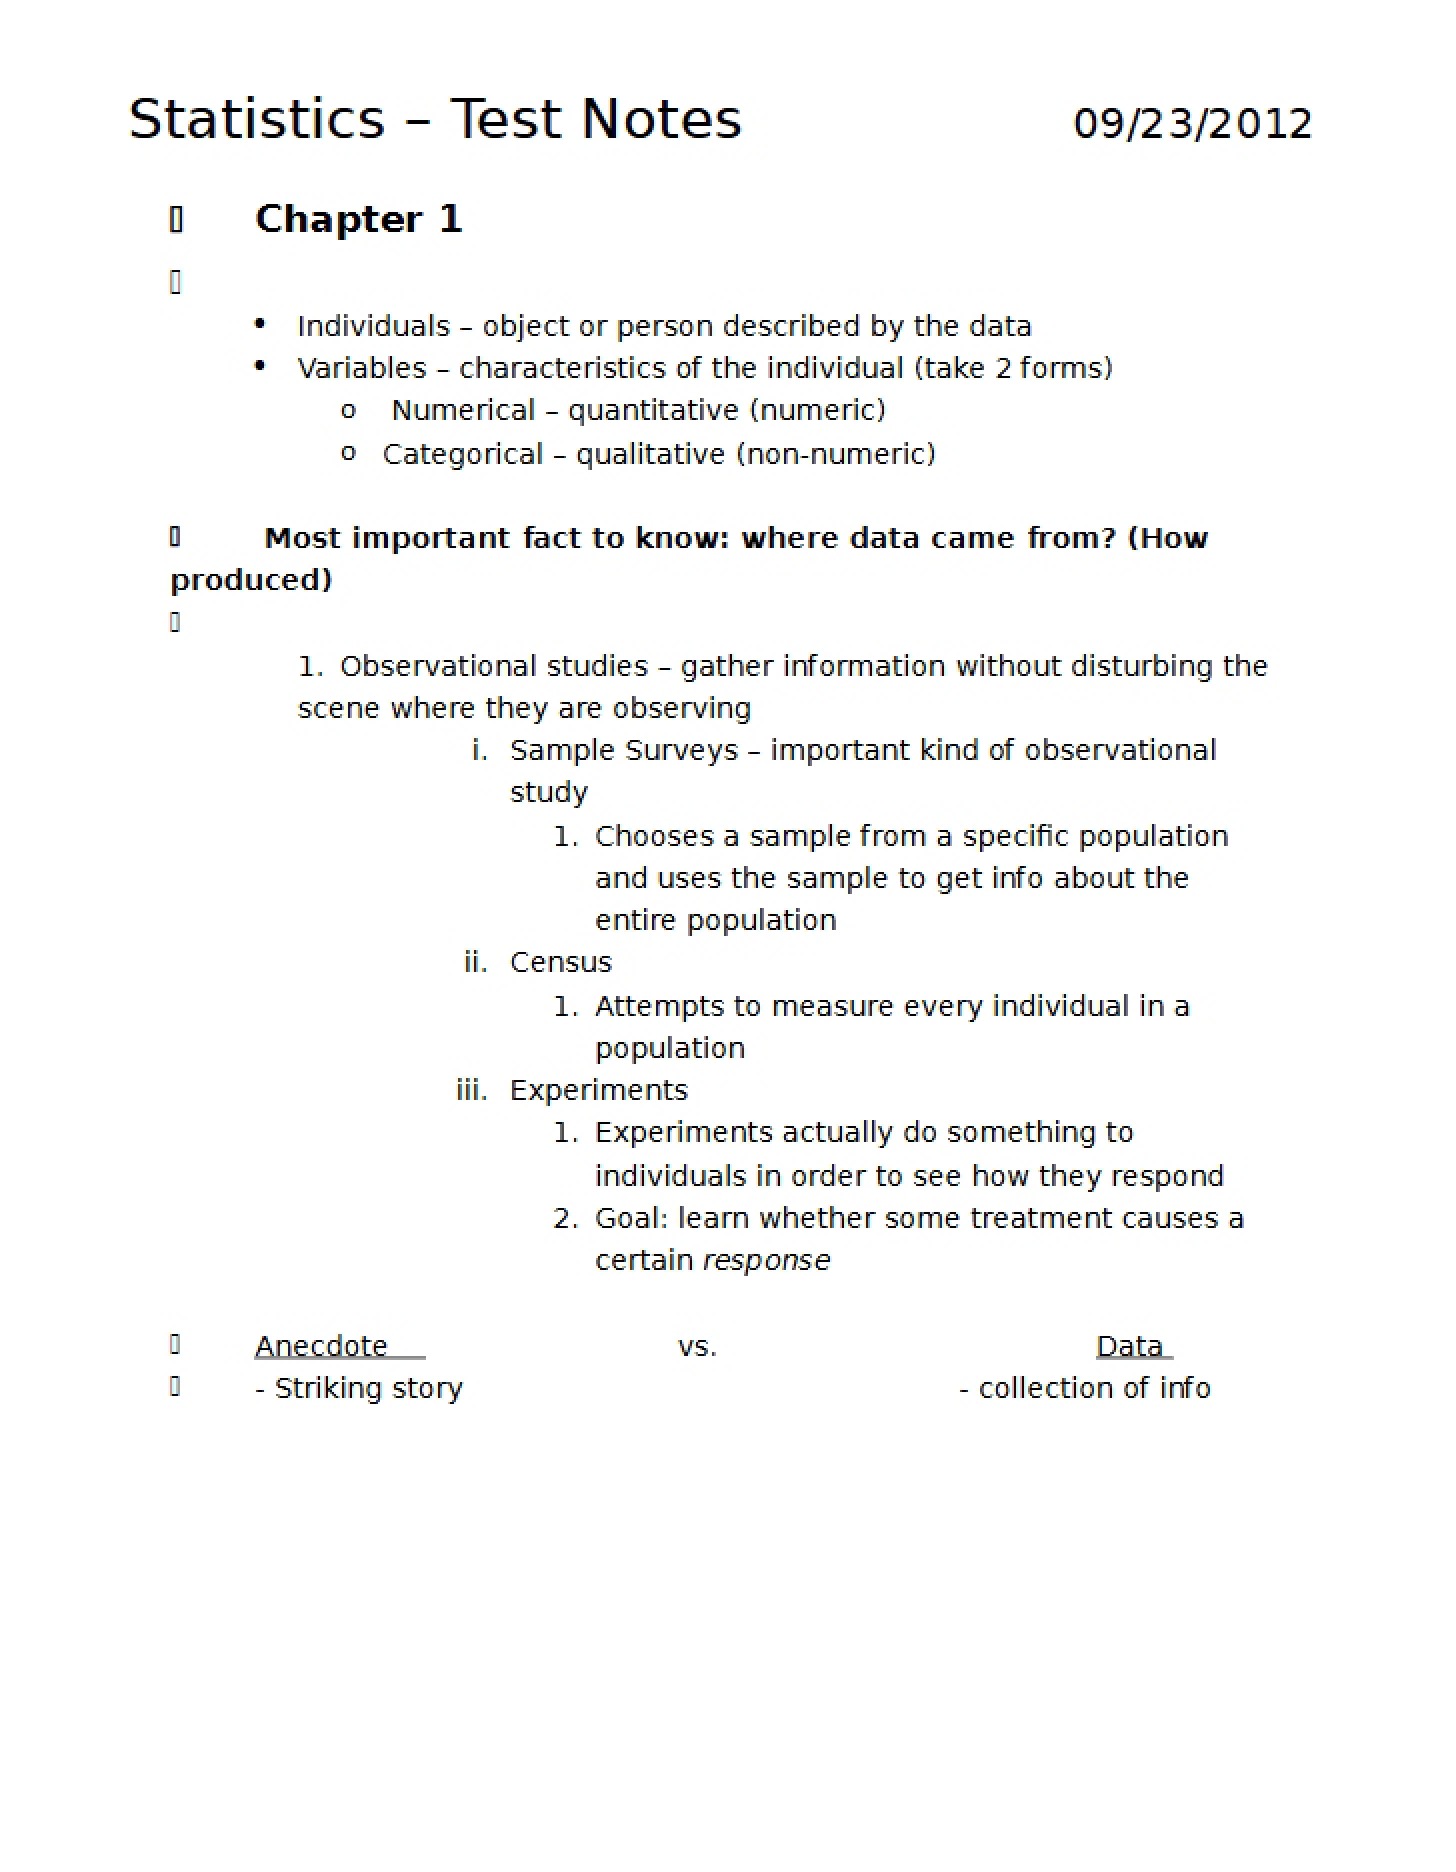
This resource is a focused exploration of fundamental concepts in descriptive statistics, specifically variable classifications and graphical data representation. Designed for students in an introductory statistics course (like STAT 201 at the University of South Carolina), it delves into the distinctions between different types of variables – those that represent categories versus those that represent numerical measurements. It further breaks down quantitative variables into discrete and continuous types. The material also introduces various methods for visually summarizing and exploring data, laying the groundwork for more advanced statistical analysis. It references the textbook *Statistics: The Art and Science of Learning from Data* by Agresti and Franklin.
Why This Document Matters
This material is crucial for any student beginning their study of statistics. A solid understanding of variable types is essential for selecting appropriate analytical techniques and correctly interpreting results. The concepts covered here are foundational for success in subsequent topics, including data visualization, probability, and inferential statistics. Students preparing for quizzes or exams on descriptive statistics will find this a valuable review tool. It’s particularly helpful for those who benefit from clear explanations and illustrative examples – though those specific examples are only available with full access.
Common Limitations or Challenges
This resource focuses on the *identification* and *categorization* of variables and data displays. It does not provide step-by-step instructions on *how* to create these graphs or perform calculations. It also doesn’t cover the underlying mathematical formulas or statistical tests associated with these concepts. It’s a building-block resource, meant to be supplemented with practice problems and further instruction. Accessing the full document is required to see detailed worked examples and practice questions.
What This Document Provides
* A clear distinction between categorical and quantitative variables.
* An explanation of discrete versus continuous quantitative variables.
* An overview of common methods for displaying categorical data.
* An introduction to graphical representations of quantitative data, including dot plots, stem-and-leaf plots, and histograms.
* Discussion of common histogram shapes (uniform, bimodal, bell-shaped, skewed).
* Connections to real-world data examples, based on student surveys.
* References to frequency table construction and interpretation.