What This Document Is
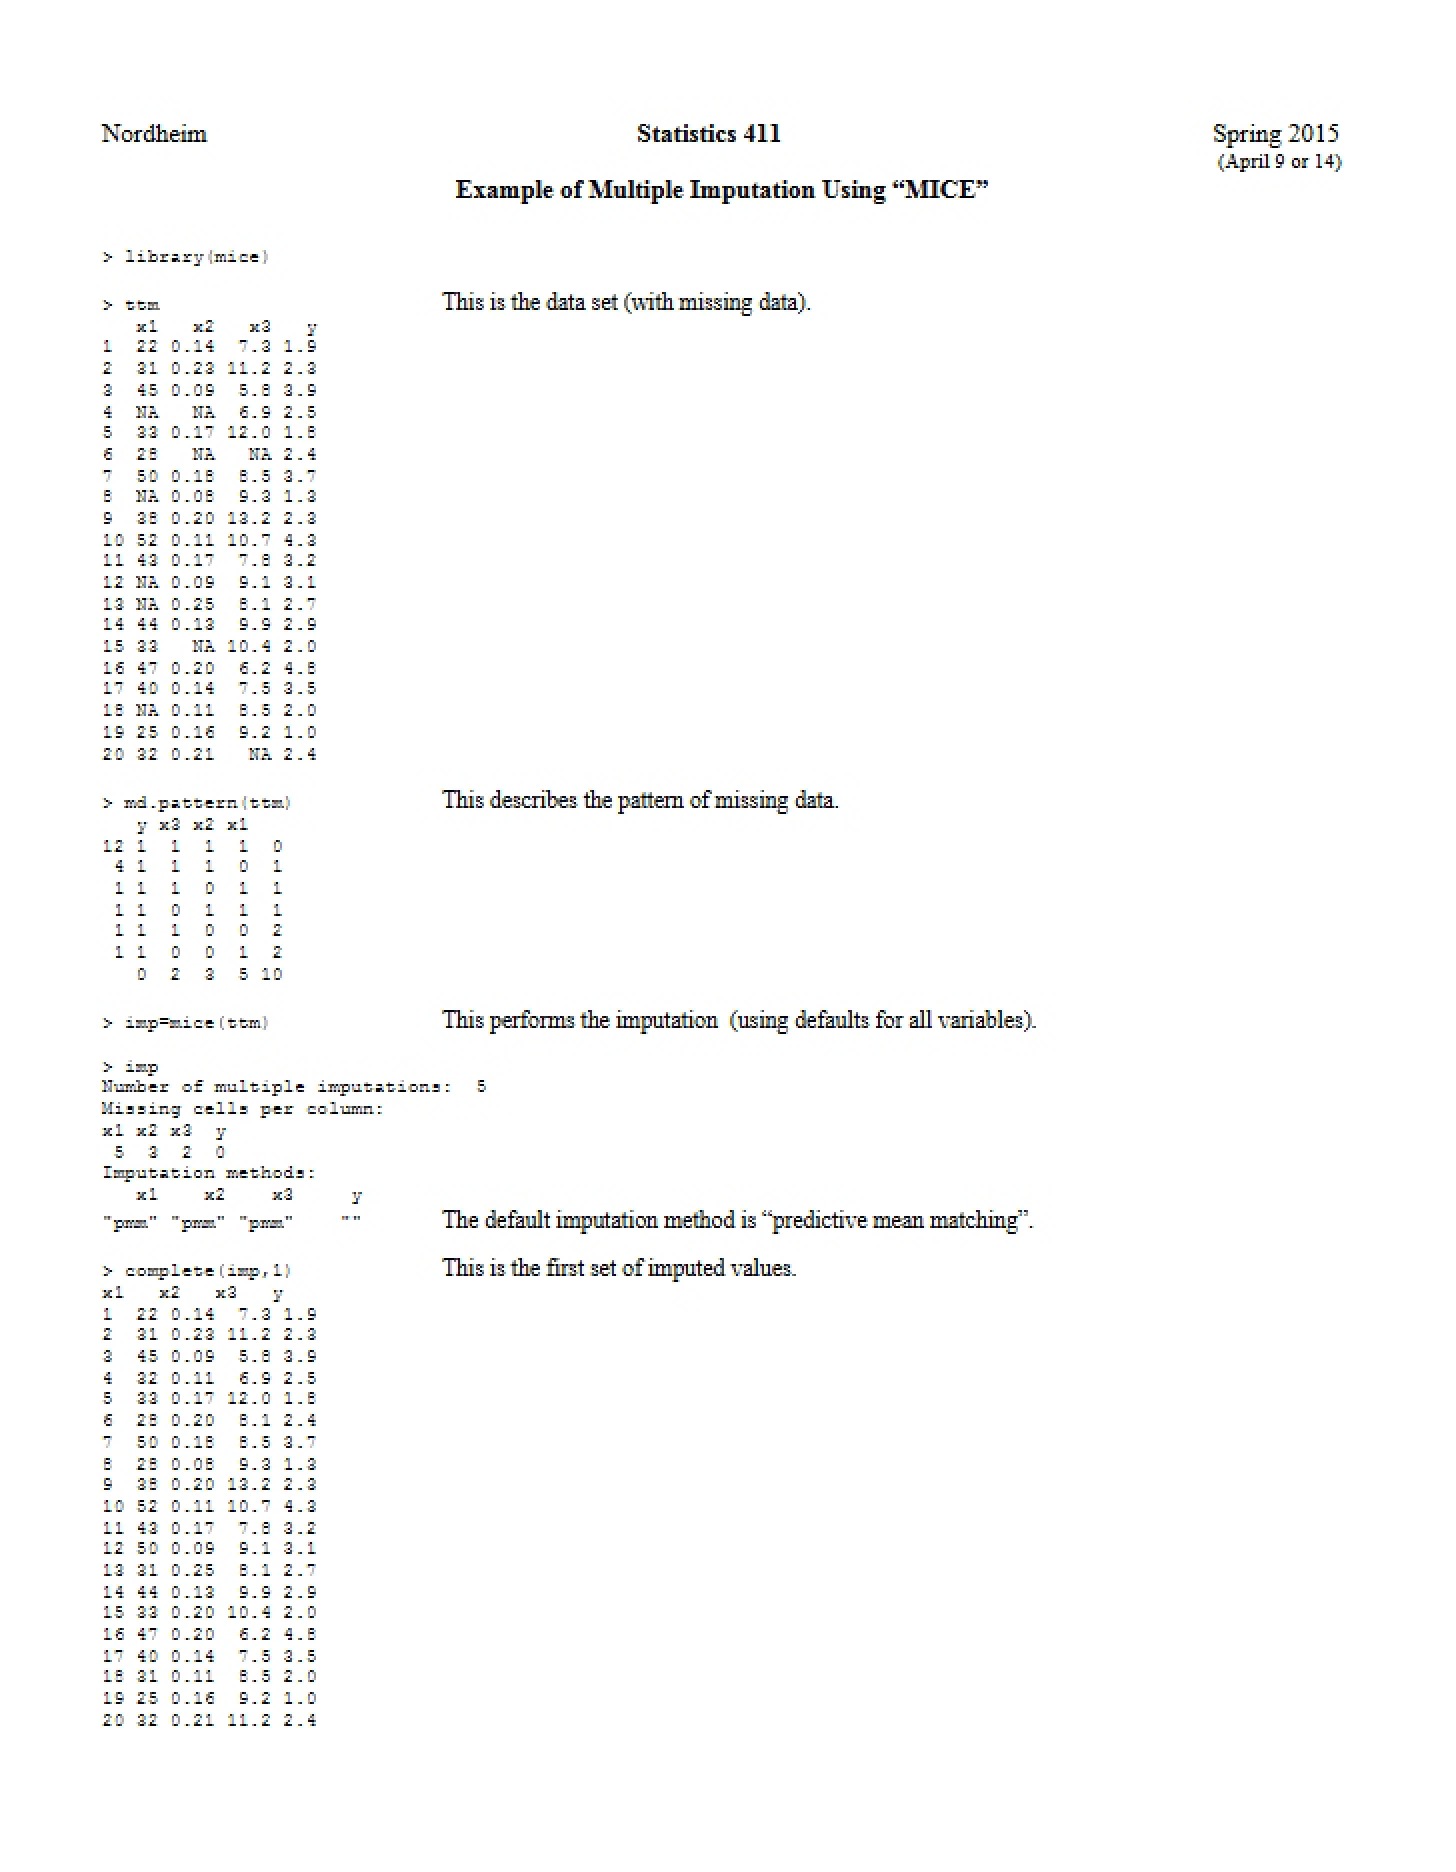
This resource is an illustrative example focused on applying multiple imputation techniques within the context of statistical survey methodology. Specifically, it demonstrates the practical implementation of the “MICE” (Multiple Imputation by Chained Equations) approach using the R statistical software environment. It’s designed as a hands-on walkthrough of a dataset containing missing values, showcasing how these values can be addressed to facilitate more robust statistical analysis. The example centers around a relatively small dataset, allowing for a clear understanding of the process without the complexities of larger, real-world datasets.
Why This Document Matters
Students enrolled in courses on survey methodology, statistical inference, or data analysis will find this example particularly valuable. It’s ideal for those seeking to solidify their understanding of how to handle missing data – a common challenge in real-world research. Researchers and practitioners who need to implement multiple imputation in their own work can use this as a starting point to understand the workflow and syntax involved. This is especially helpful for those new to the `mice` package in R. It’s best utilized *after* gaining a foundational understanding of the theoretical principles behind multiple imputation.
Common Limitations or Challenges
This example focuses on a single, relatively simple dataset. It does not cover all possible scenarios encountered when dealing with missing data, such as complex missing data mechanisms or high dimensionality. It also doesn’t delve into the theoretical justifications for choosing specific imputation methods. Furthermore, it’s important to remember that this is a demonstration; applying these techniques to your own data requires careful consideration of your specific research question and data characteristics. It does not provide a comprehensive guide to model diagnostics or assessing the quality of the imputation.
What This Document Provides
* Illustrative code snippets using the `mice` package in R.
* Demonstration of how to identify patterns of missing data within a dataset.
* An example of performing multiple imputation to generate complete datasets.
* Output from statistical modeling performed on the imputed datasets.
* A presentation of pooled coefficient estimates derived from multiple imputation results.
* Information regarding the fraction of information missing due to nonresponse.