What This Document Is
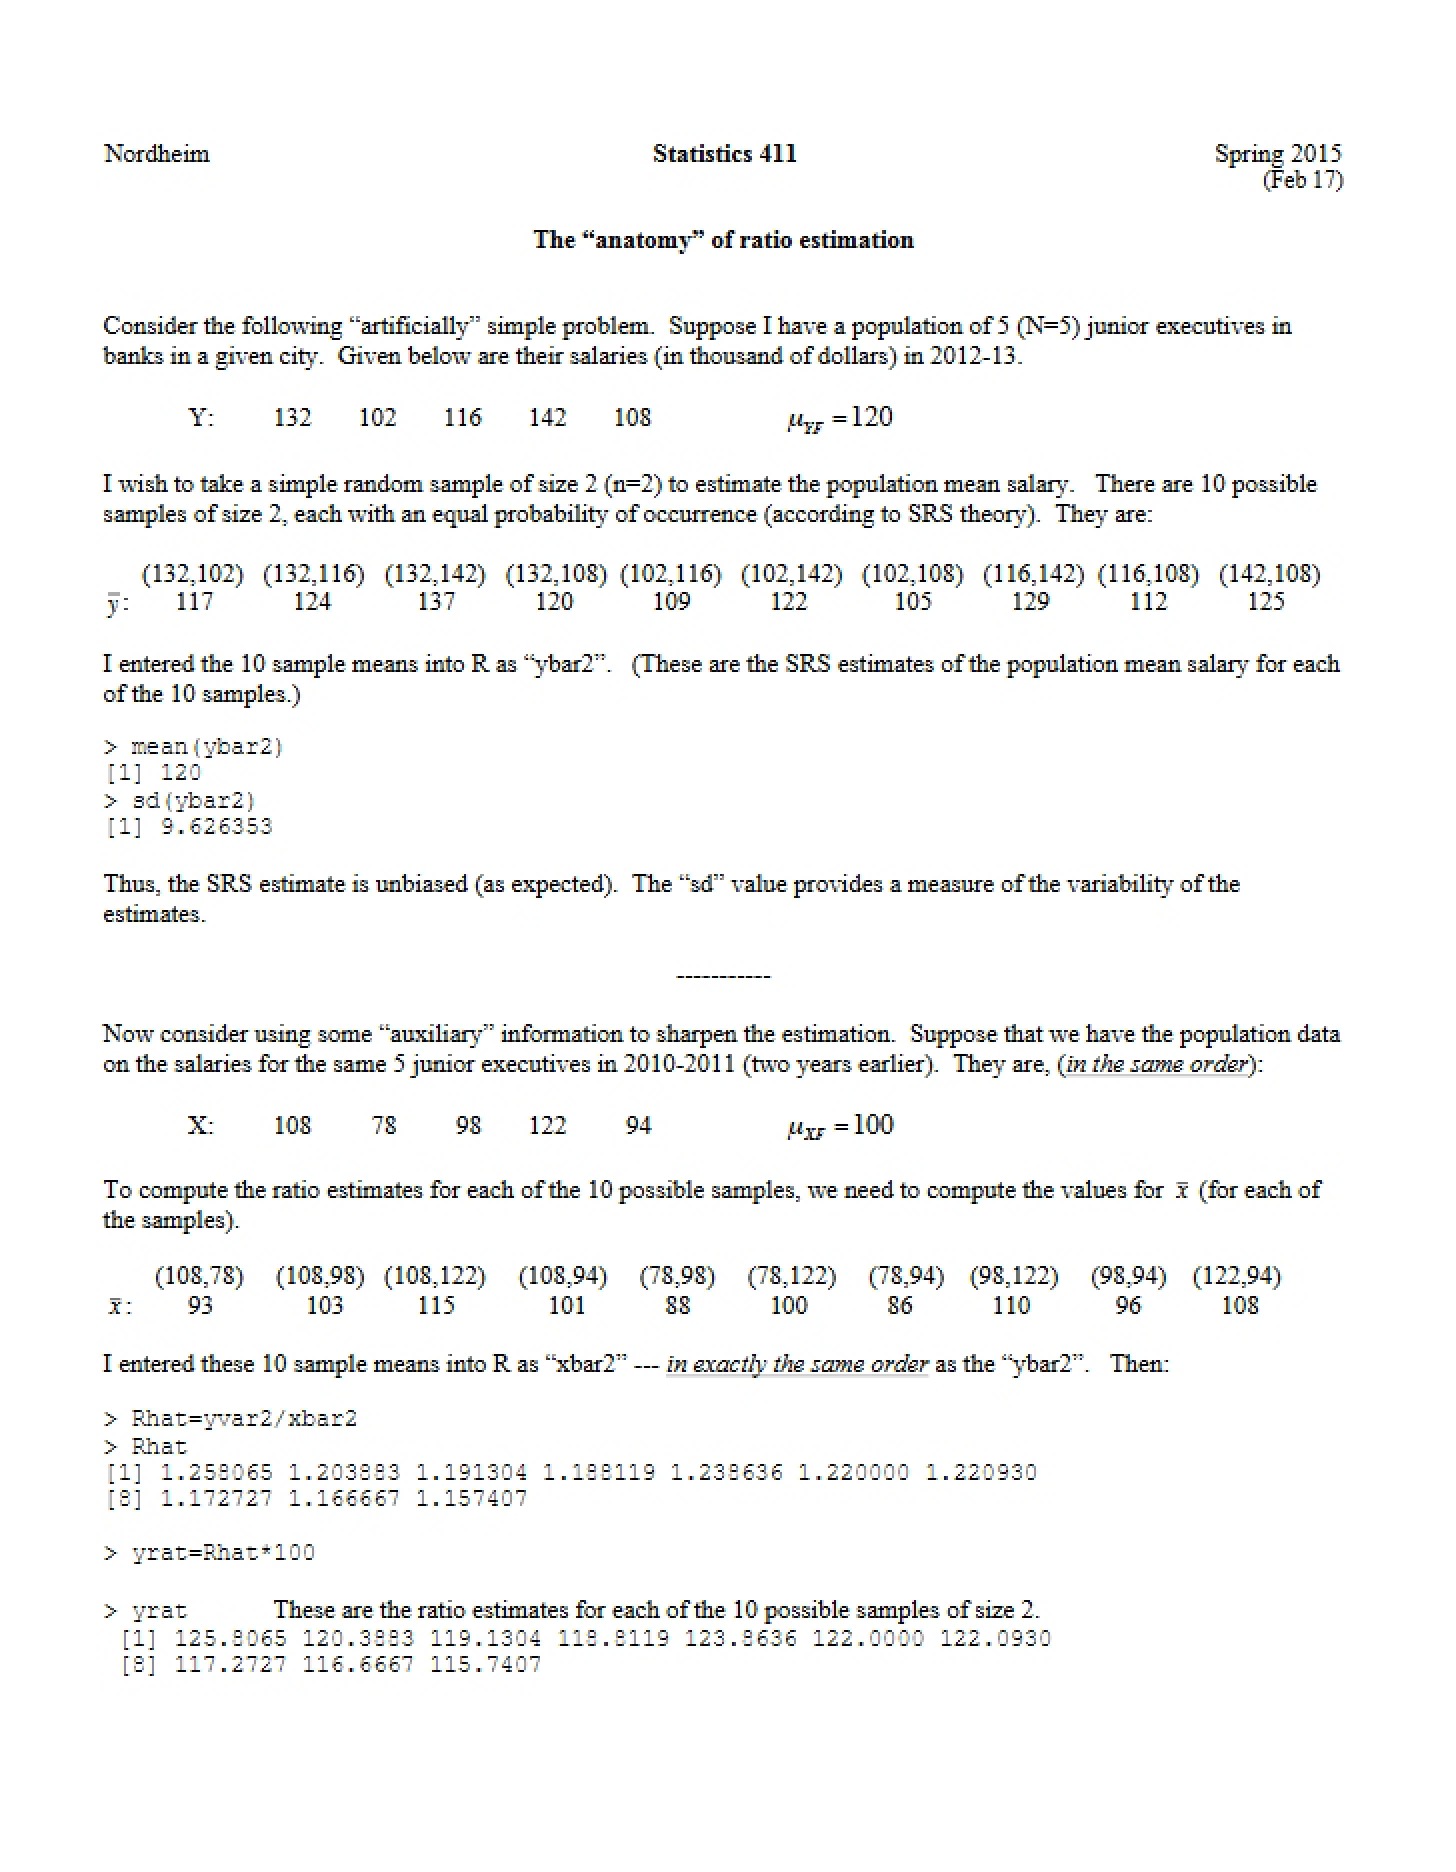
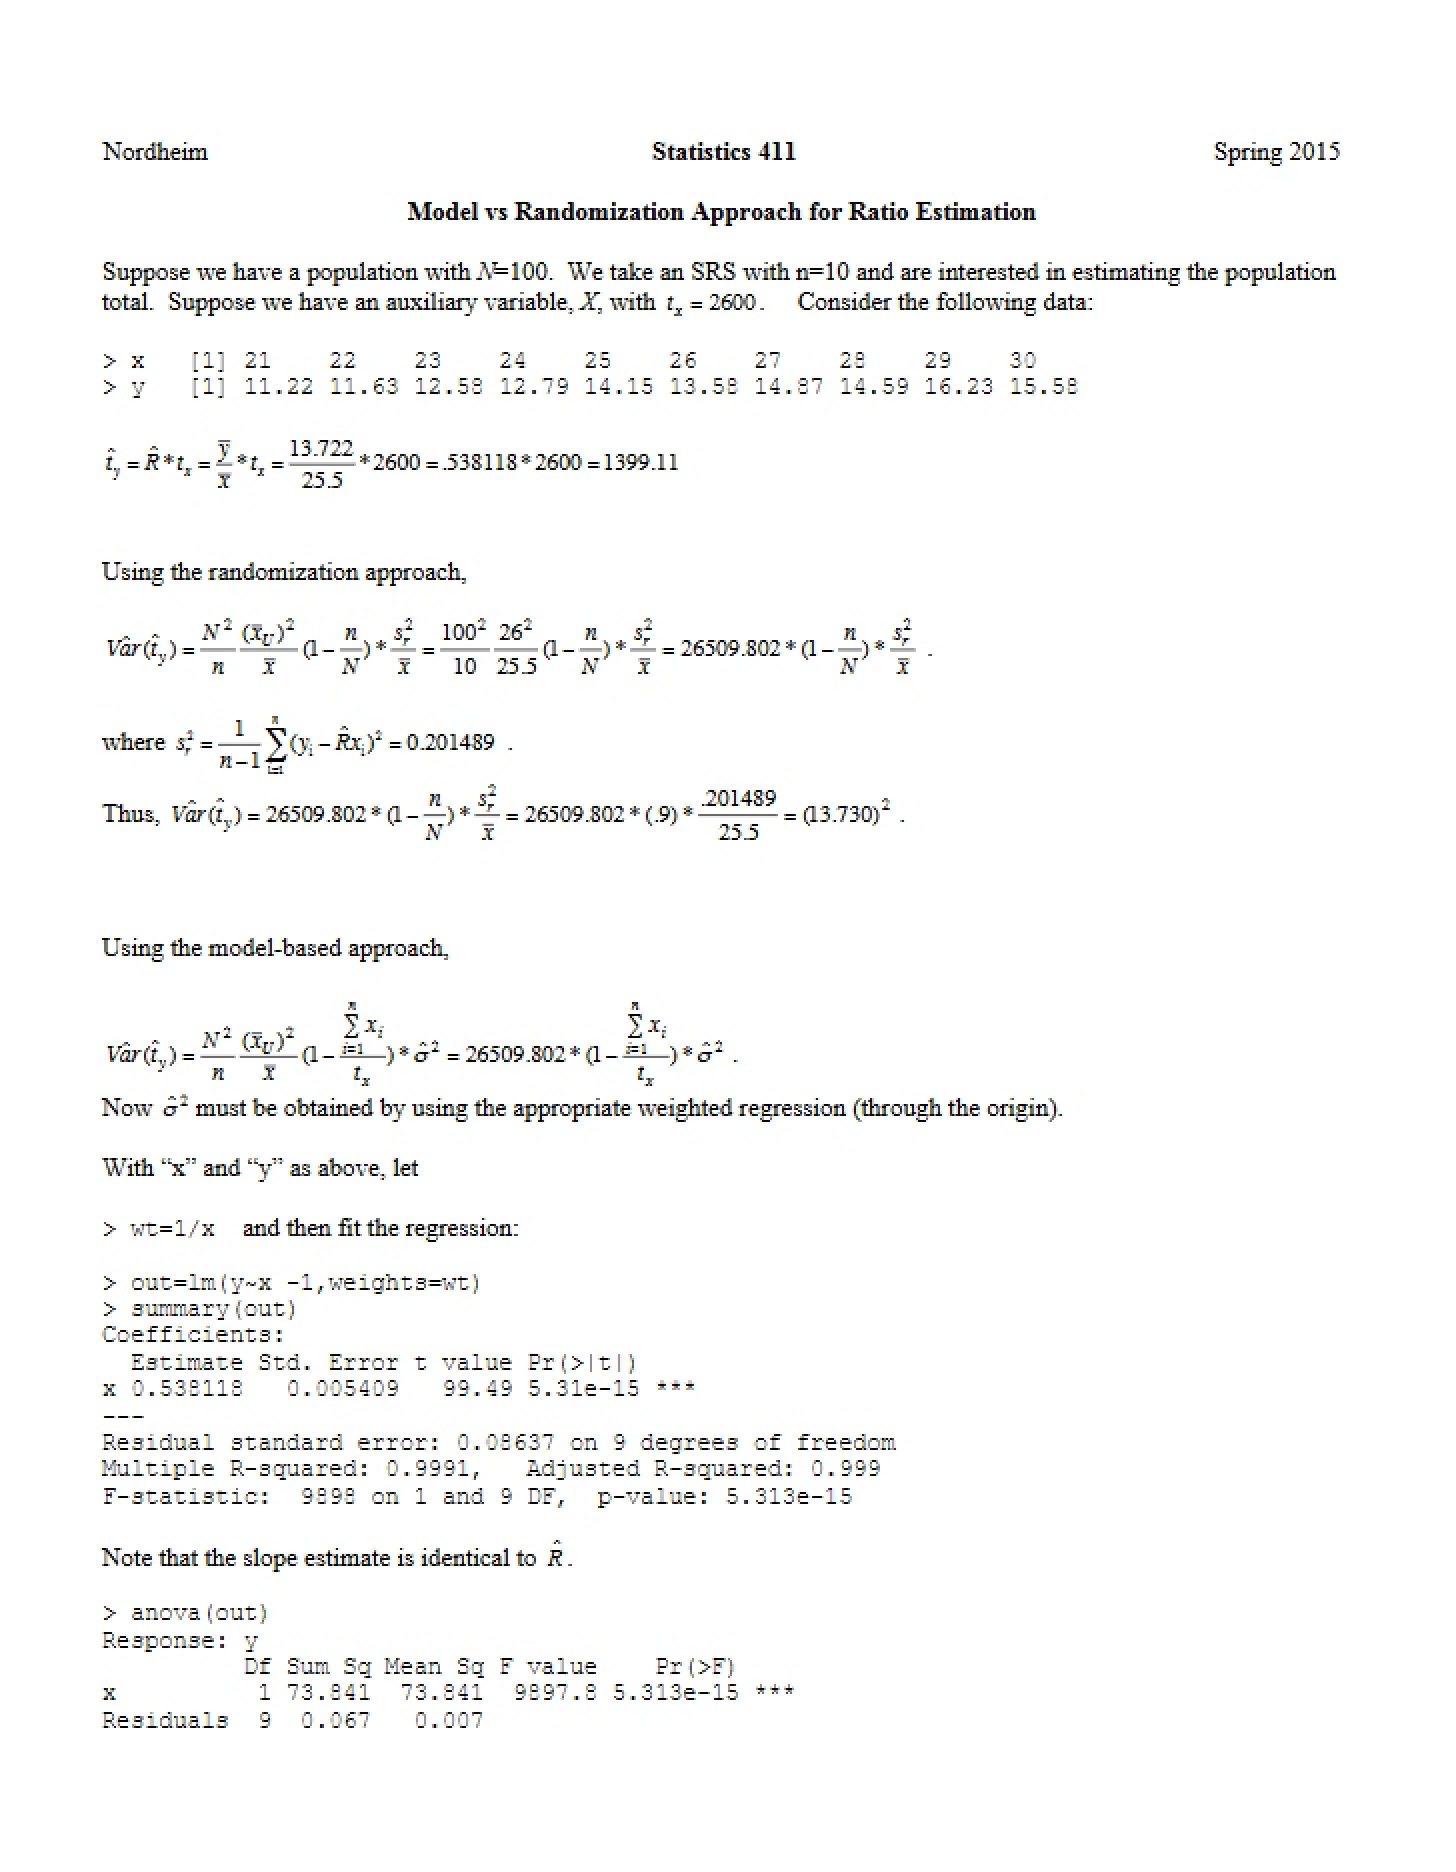
This resource is a focused guide detailing the application of ratio estimation – a statistical technique used in survey methodology – utilizing the R programming language. It’s designed as a practical companion to theoretical coursework on sample surveys, bridging the gap between statistical concepts and their real-world implementation. The material centers around a specific example dataset and progressively builds understanding of the calculations involved.
Why This Document Matters
Students enrolled in courses covering survey sampling, statistical inference, or applied regression analysis will find this particularly valuable. It’s ideal for those seeking to solidify their understanding of ratio estimation beyond textbook definitions and formulas. Researchers and analysts who need to implement ratio estimation in their own projects, and prefer a hands-on approach to understanding the underlying computations, will also benefit. This is especially useful when dealing with larger datasets where manual calculation becomes impractical. It’s best used *after* foundational concepts of ratio estimation have been introduced.
Common Limitations or Challenges
This guide focuses specifically on implementing ratio estimation *within R*. It does not provide a comprehensive overview of survey sampling theory itself, nor does it cover alternative estimation methods. While it touches upon variance estimation, it doesn’t delve into advanced variance reduction techniques. Furthermore, it concentrates on a single illustrative example; applying the techniques to different datasets will require adaptation and independent problem-solving. It also notes the existence of more comprehensive R packages, but deliberately avoids detailed instruction on their use, prioritizing a fundamental understanding of the calculations.
What This Document Provides
* A step-by-step approach to performing ratio estimation calculations in R.
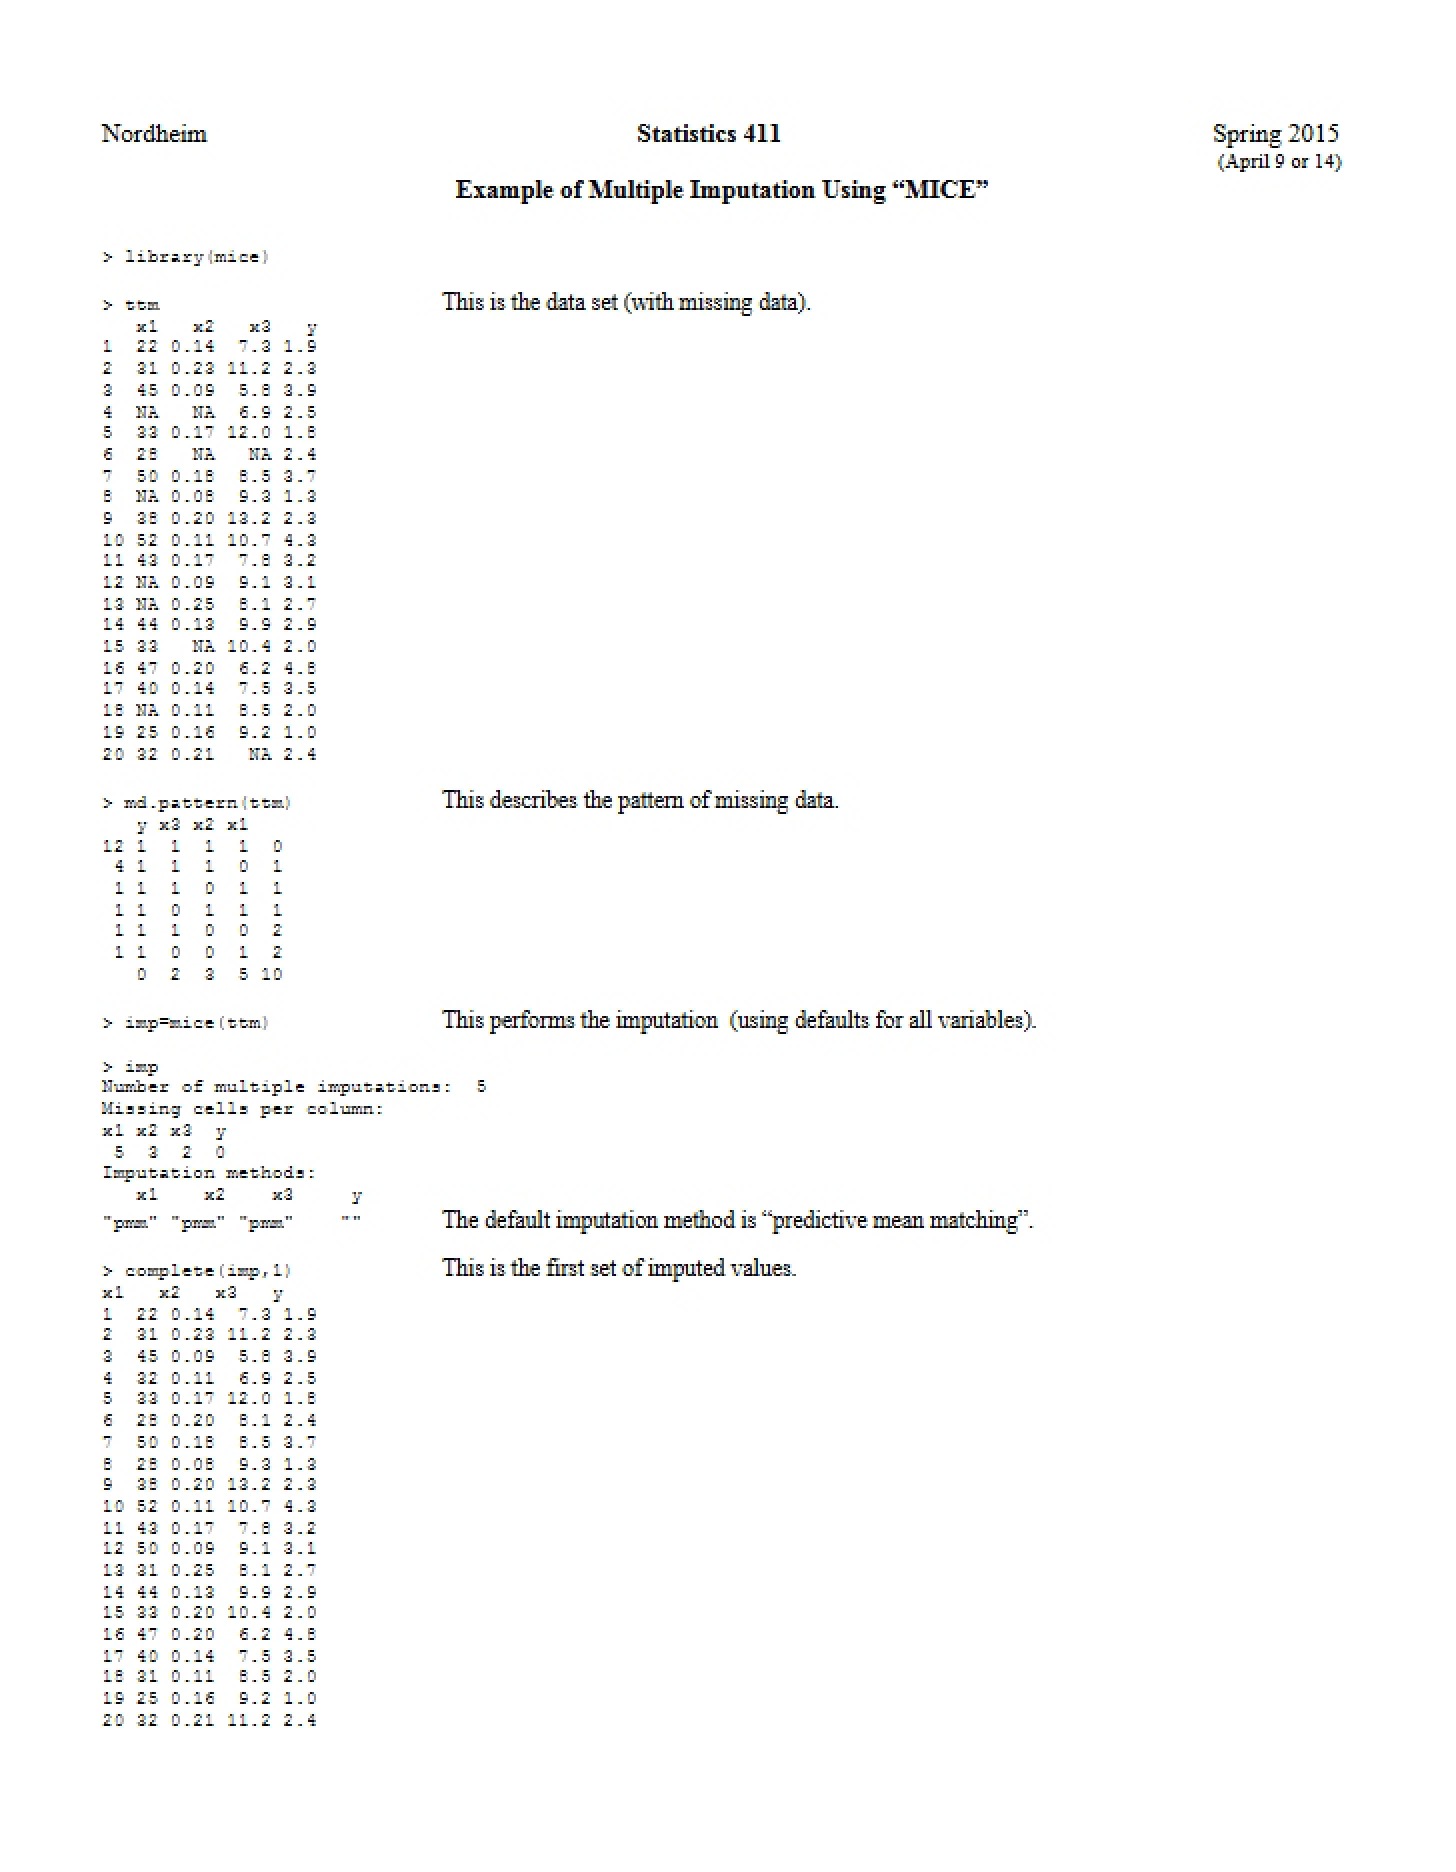
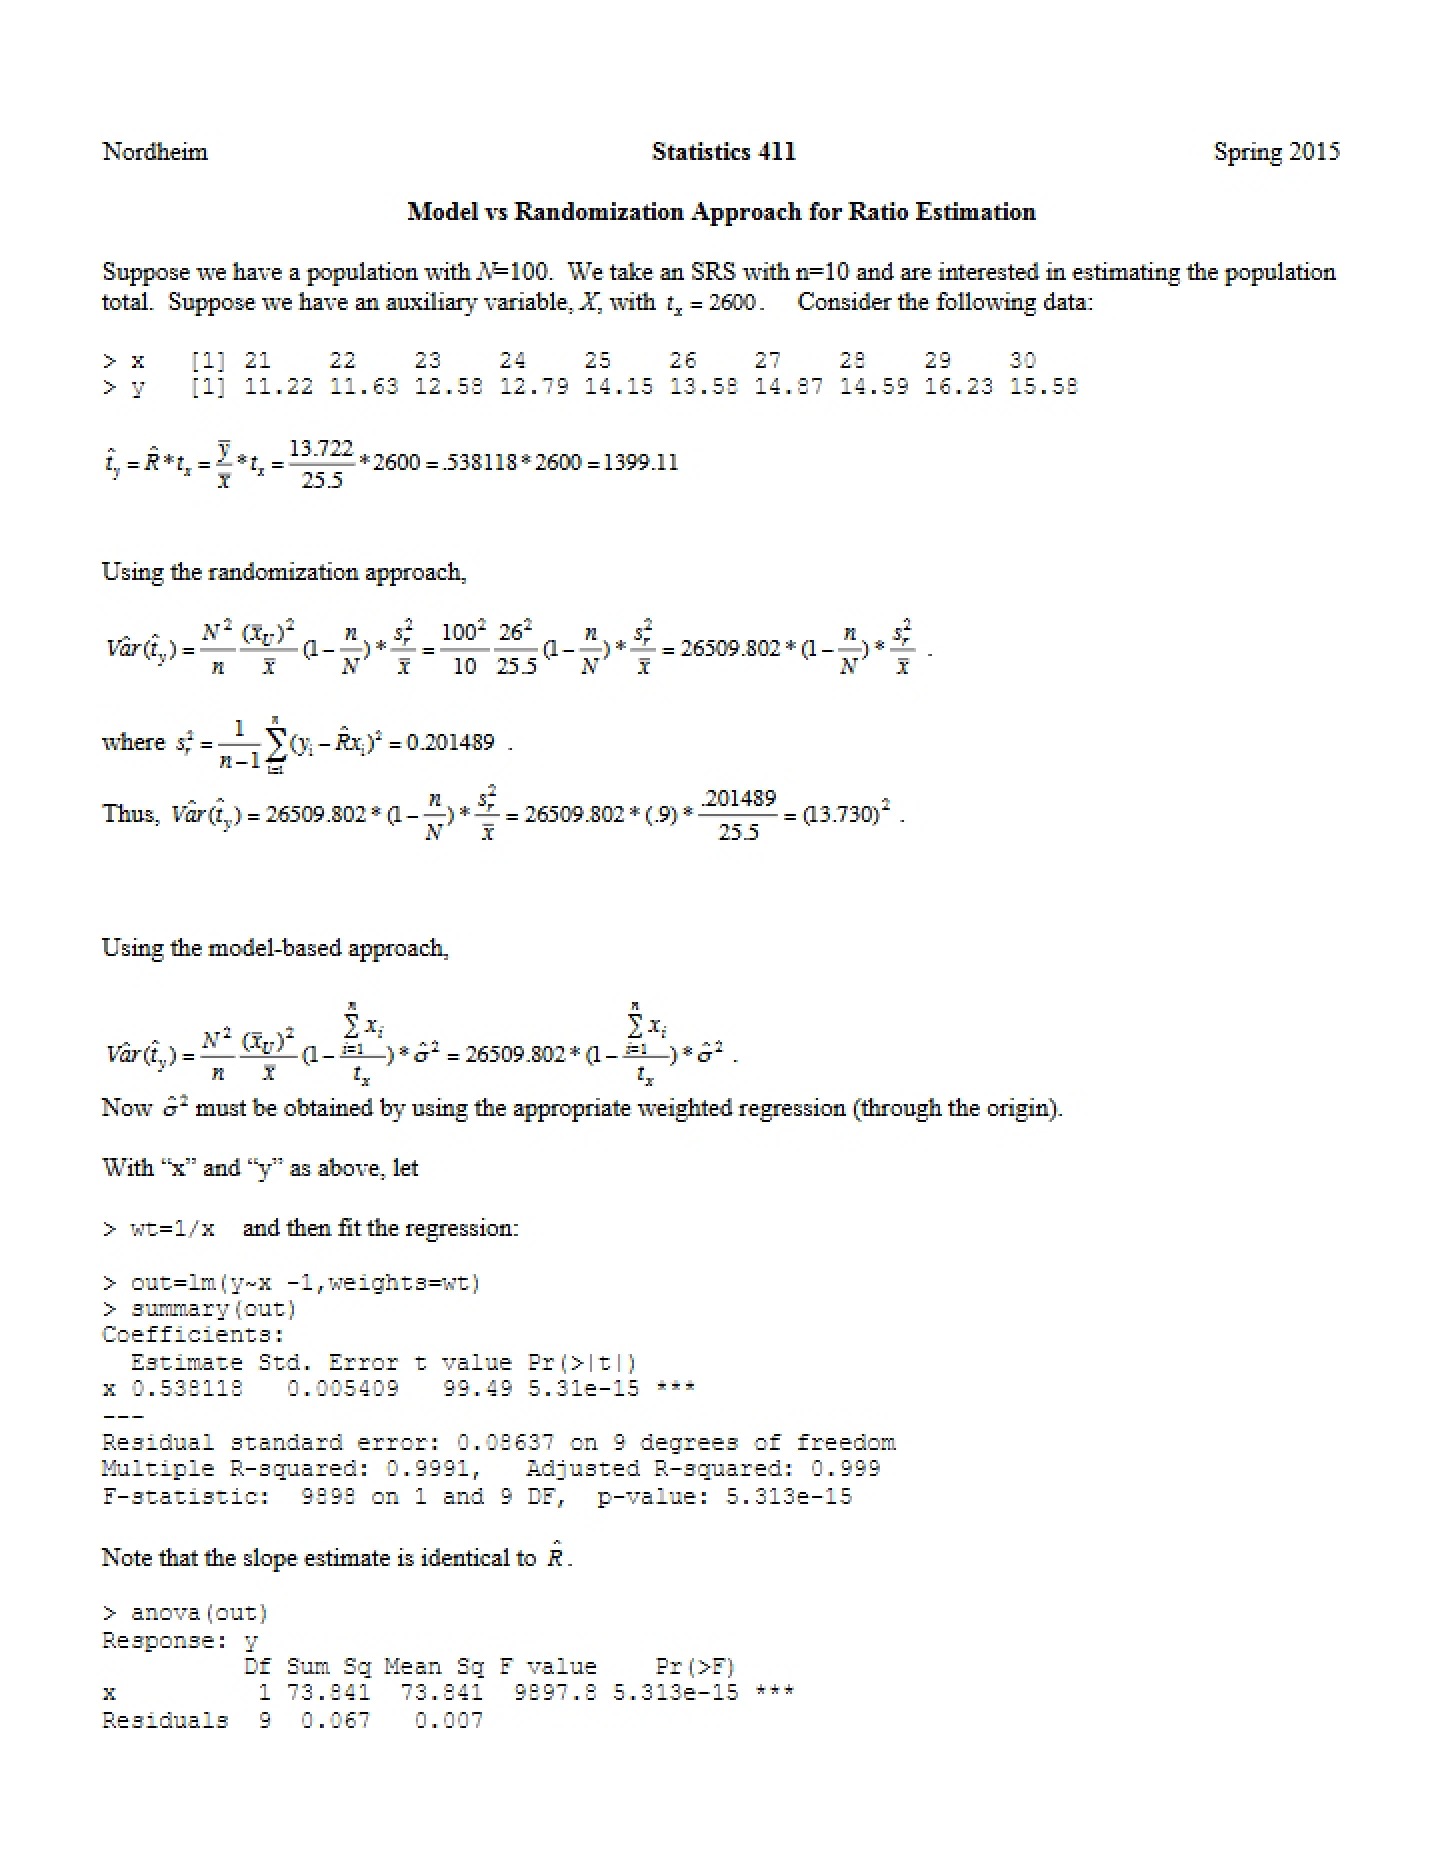
* Illustrative examples demonstrating the process from data input to variance estimation.
* Discussion of the importance of data visualization in the context of ratio estimation.
* Explanation of key statistical measures related to ratio estimation, such as the ratio estimator itself and its associated standard error.
* A comparison of the variance obtained through ratio estimation versus simple random sampling.