What This Document Is
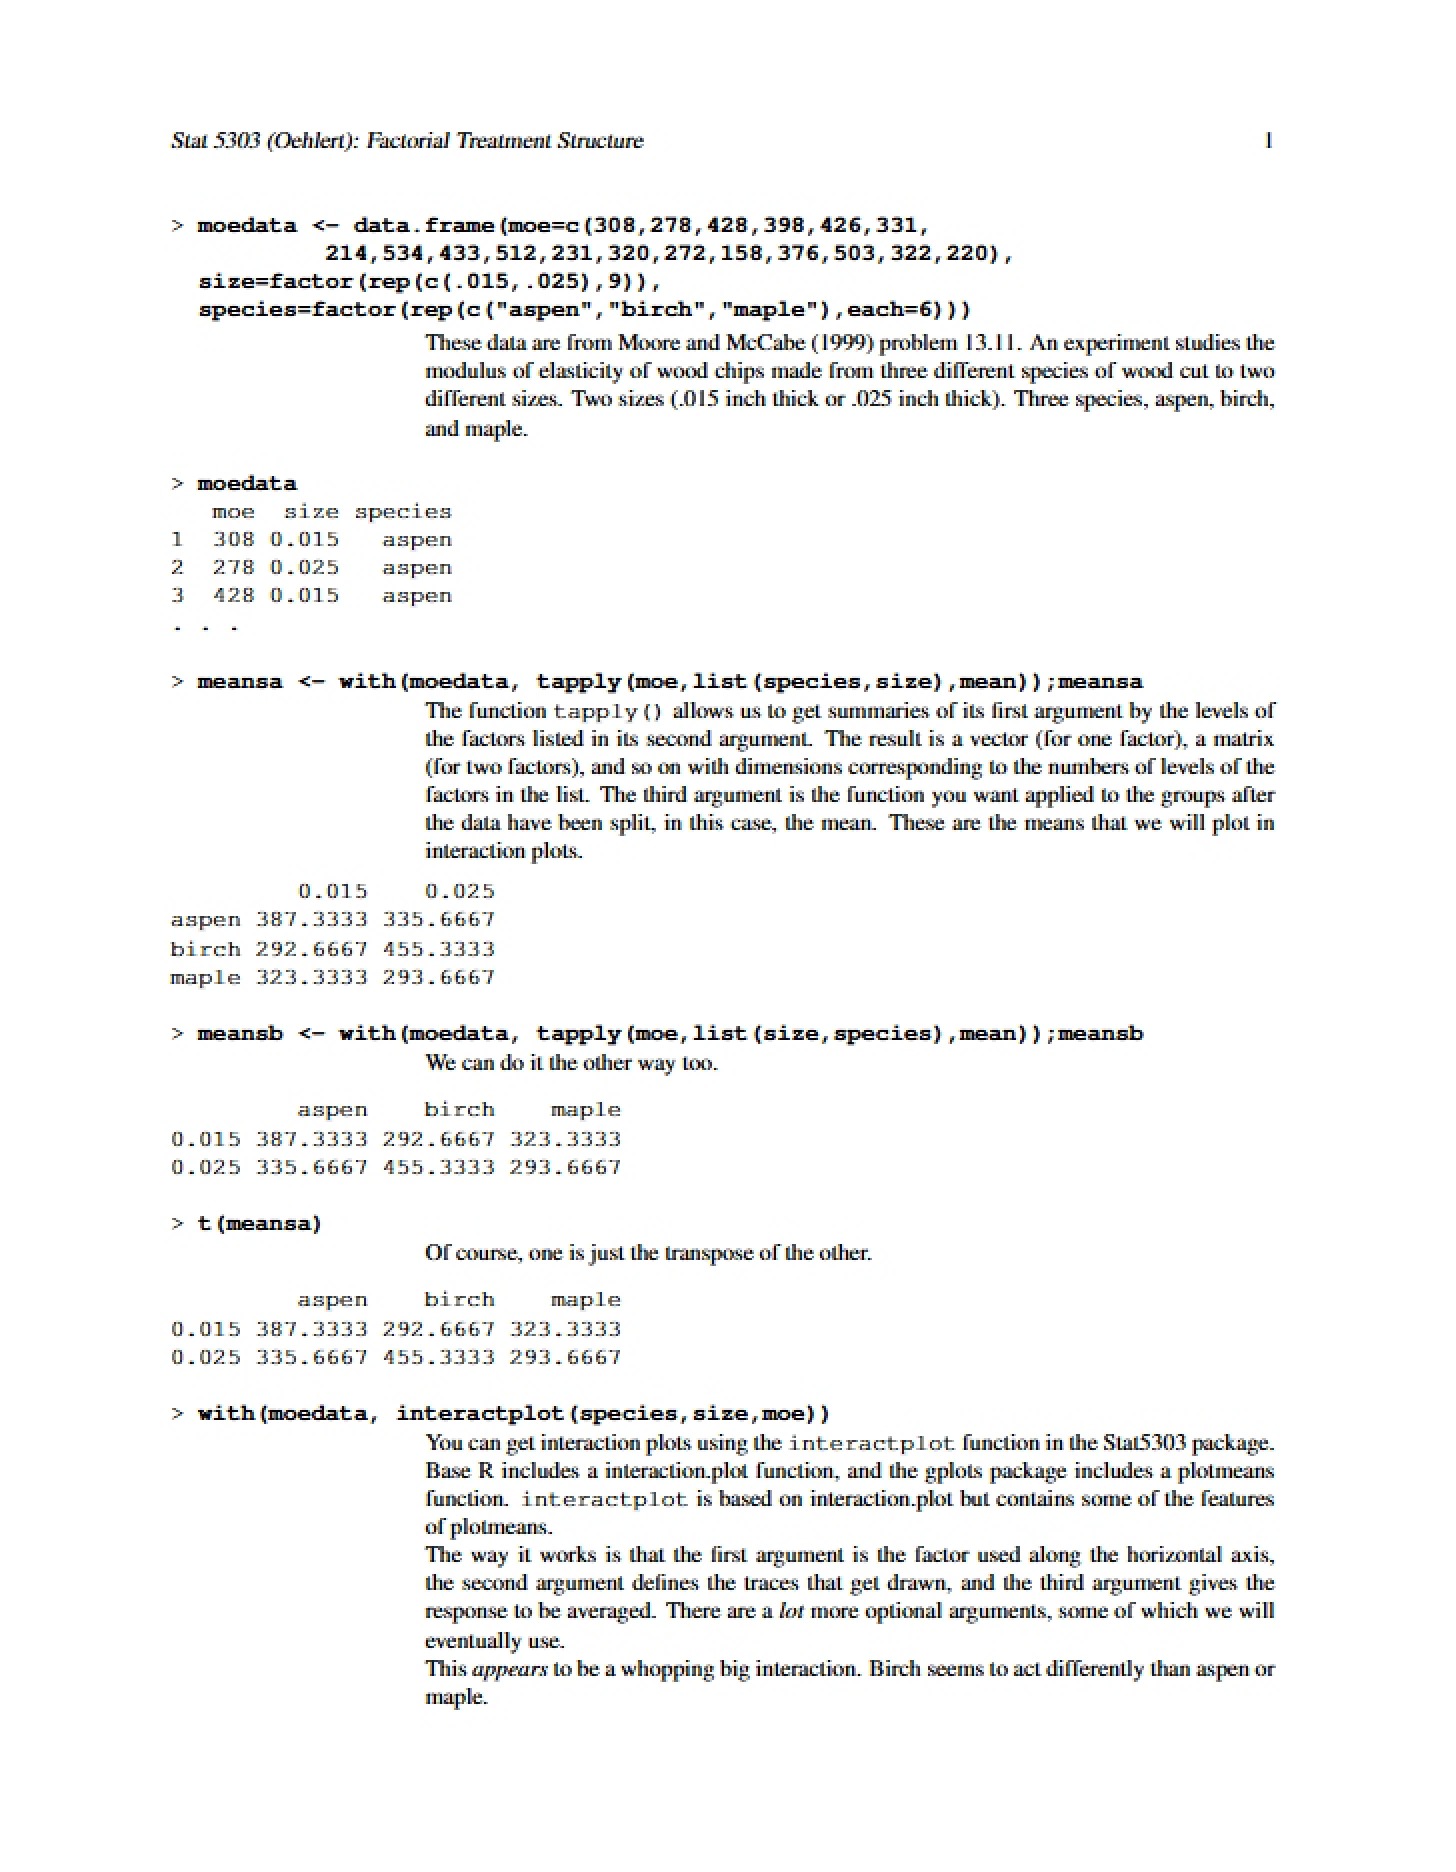
This resource is a focused exploration of factorial treatment structures within the field of statistical design. It delves into the practical application of analyzing data originating from experiments where multiple factors are simultaneously varied to observe their effects. The material centers around using statistical software to visualize and interpret these complex experimental results, specifically focusing on identifying interactions between different factors influencing an outcome. It’s geared towards students learning to dissect and understand the nuances of designed experiments.
Why This Document Matters
Students enrolled in courses on experimental design, analysis of variance (ANOVA), or regression will find this particularly valuable. It’s ideal for those seeking to solidify their understanding of how to represent and interpret factorial experiments. This resource is most helpful when you’re grappling with understanding how to visually assess the relationships between multiple independent variables and a dependent variable, and when you need to determine if the effect of one variable depends on the level of another. It’s a strong companion to lectures and textbooks covering these concepts.
Common Limitations or Challenges
This material does not provide a comprehensive introduction to the *principles* of experimental design. It assumes a foundational understanding of concepts like factors, levels, and treatments. It also doesn’t cover the theoretical underpinnings of ANOVA or the mathematical derivations behind the statistical tests. The focus is strictly on the *application* of techniques for visualizing and initially interpreting factorial data, not on designing experiments from scratch or performing detailed statistical calculations.
What This Document Provides
* Illustrations of how to input experimental data into statistical software.
* Examples of using software functions to summarize data based on different factor combinations.
* Demonstrations of creating interaction plots to visually assess relationships between variables.
* Discussions on how the arrangement of variables in interaction plots can influence interpretation.
* Exploration of how error bars can impact the assessment of interaction effects.
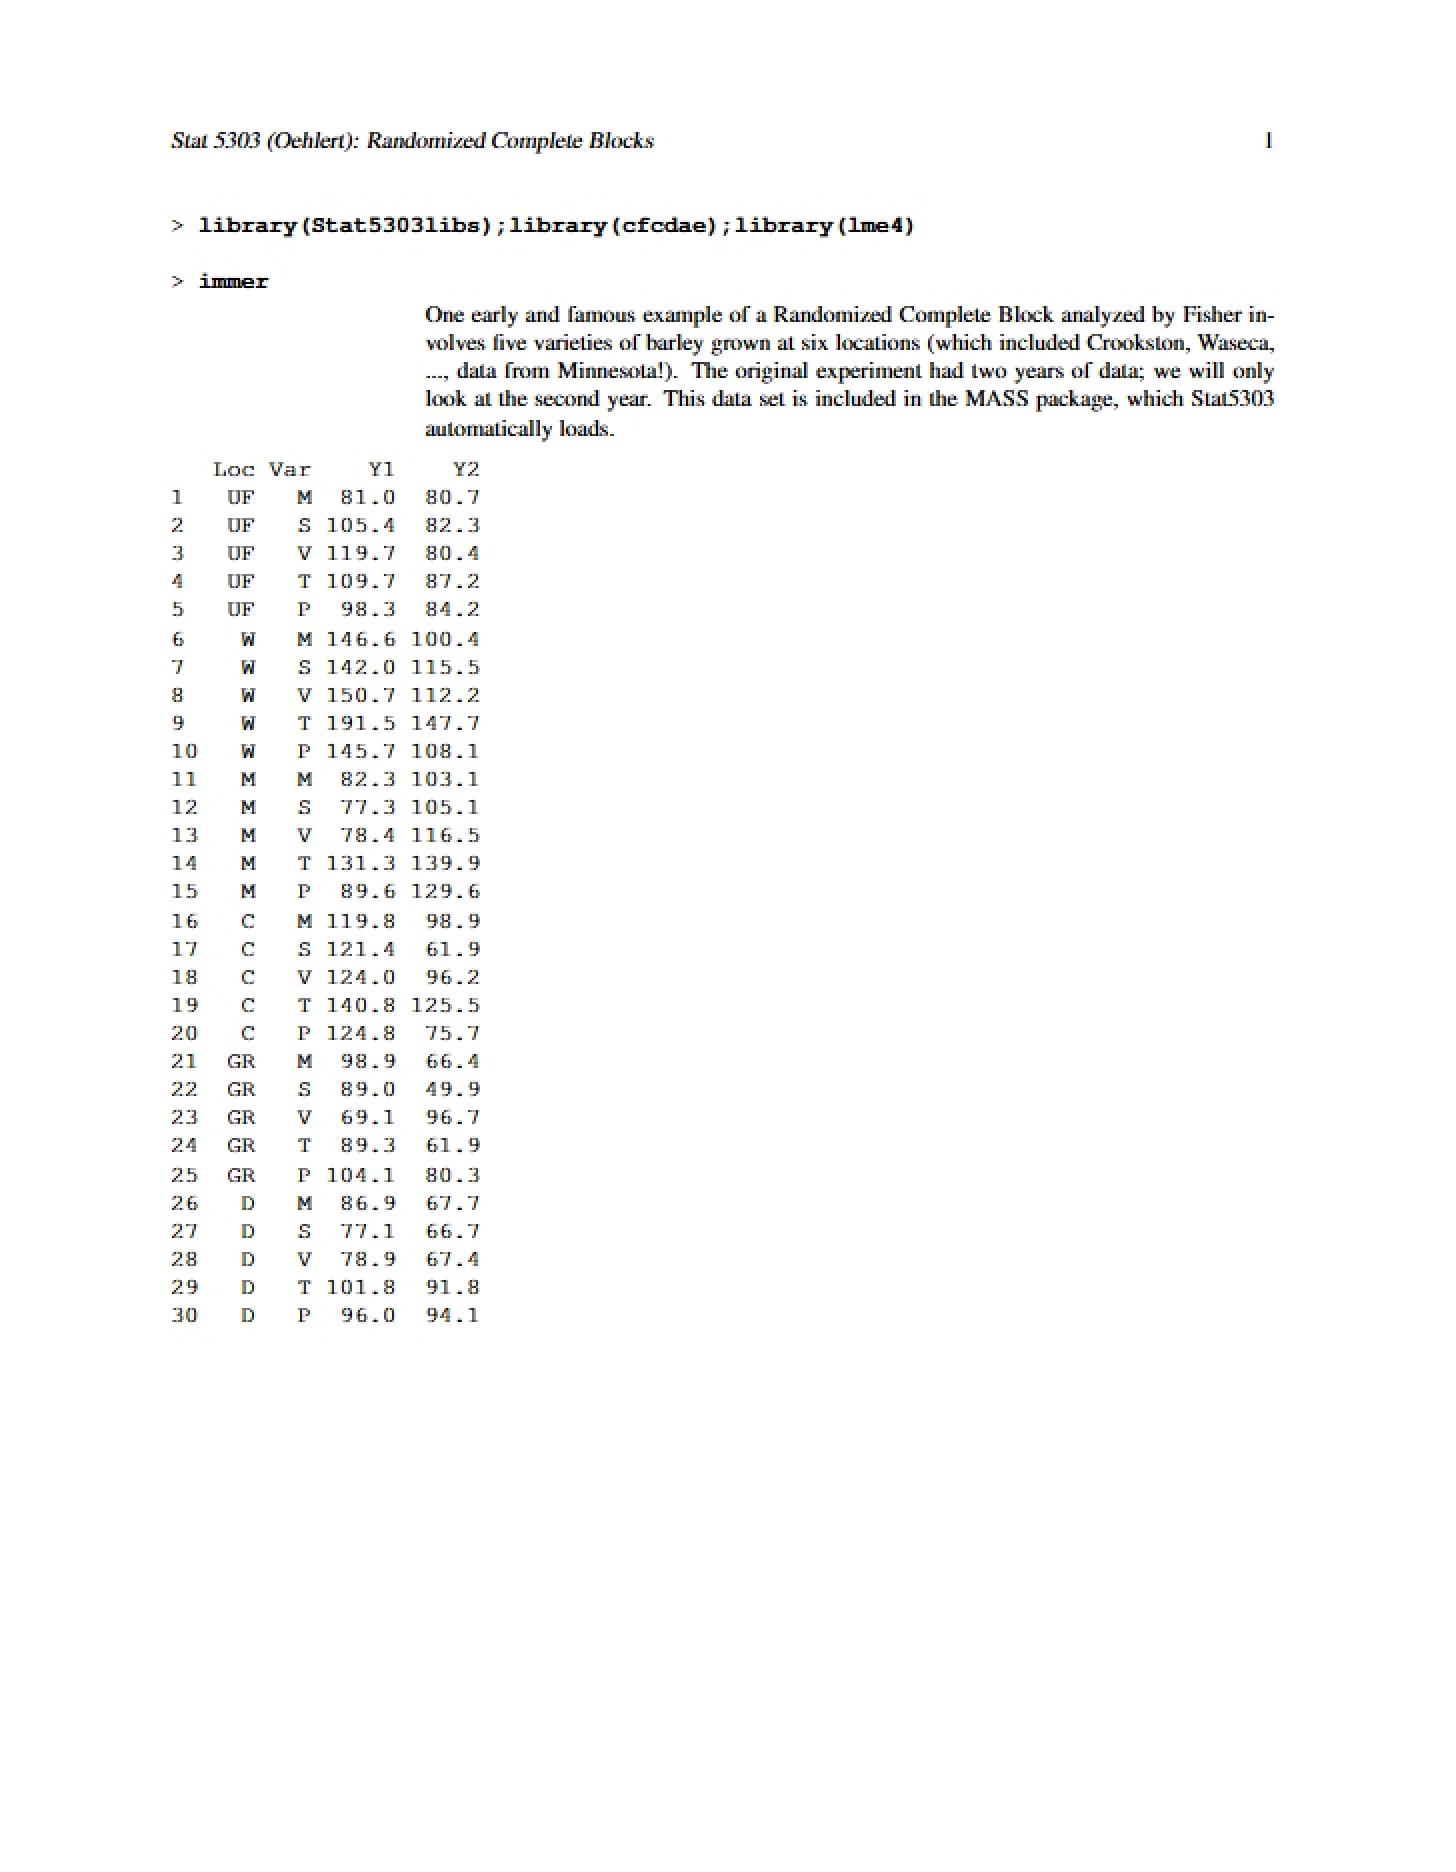
* Examples using different datasets to illustrate the concepts.