What This Document Is
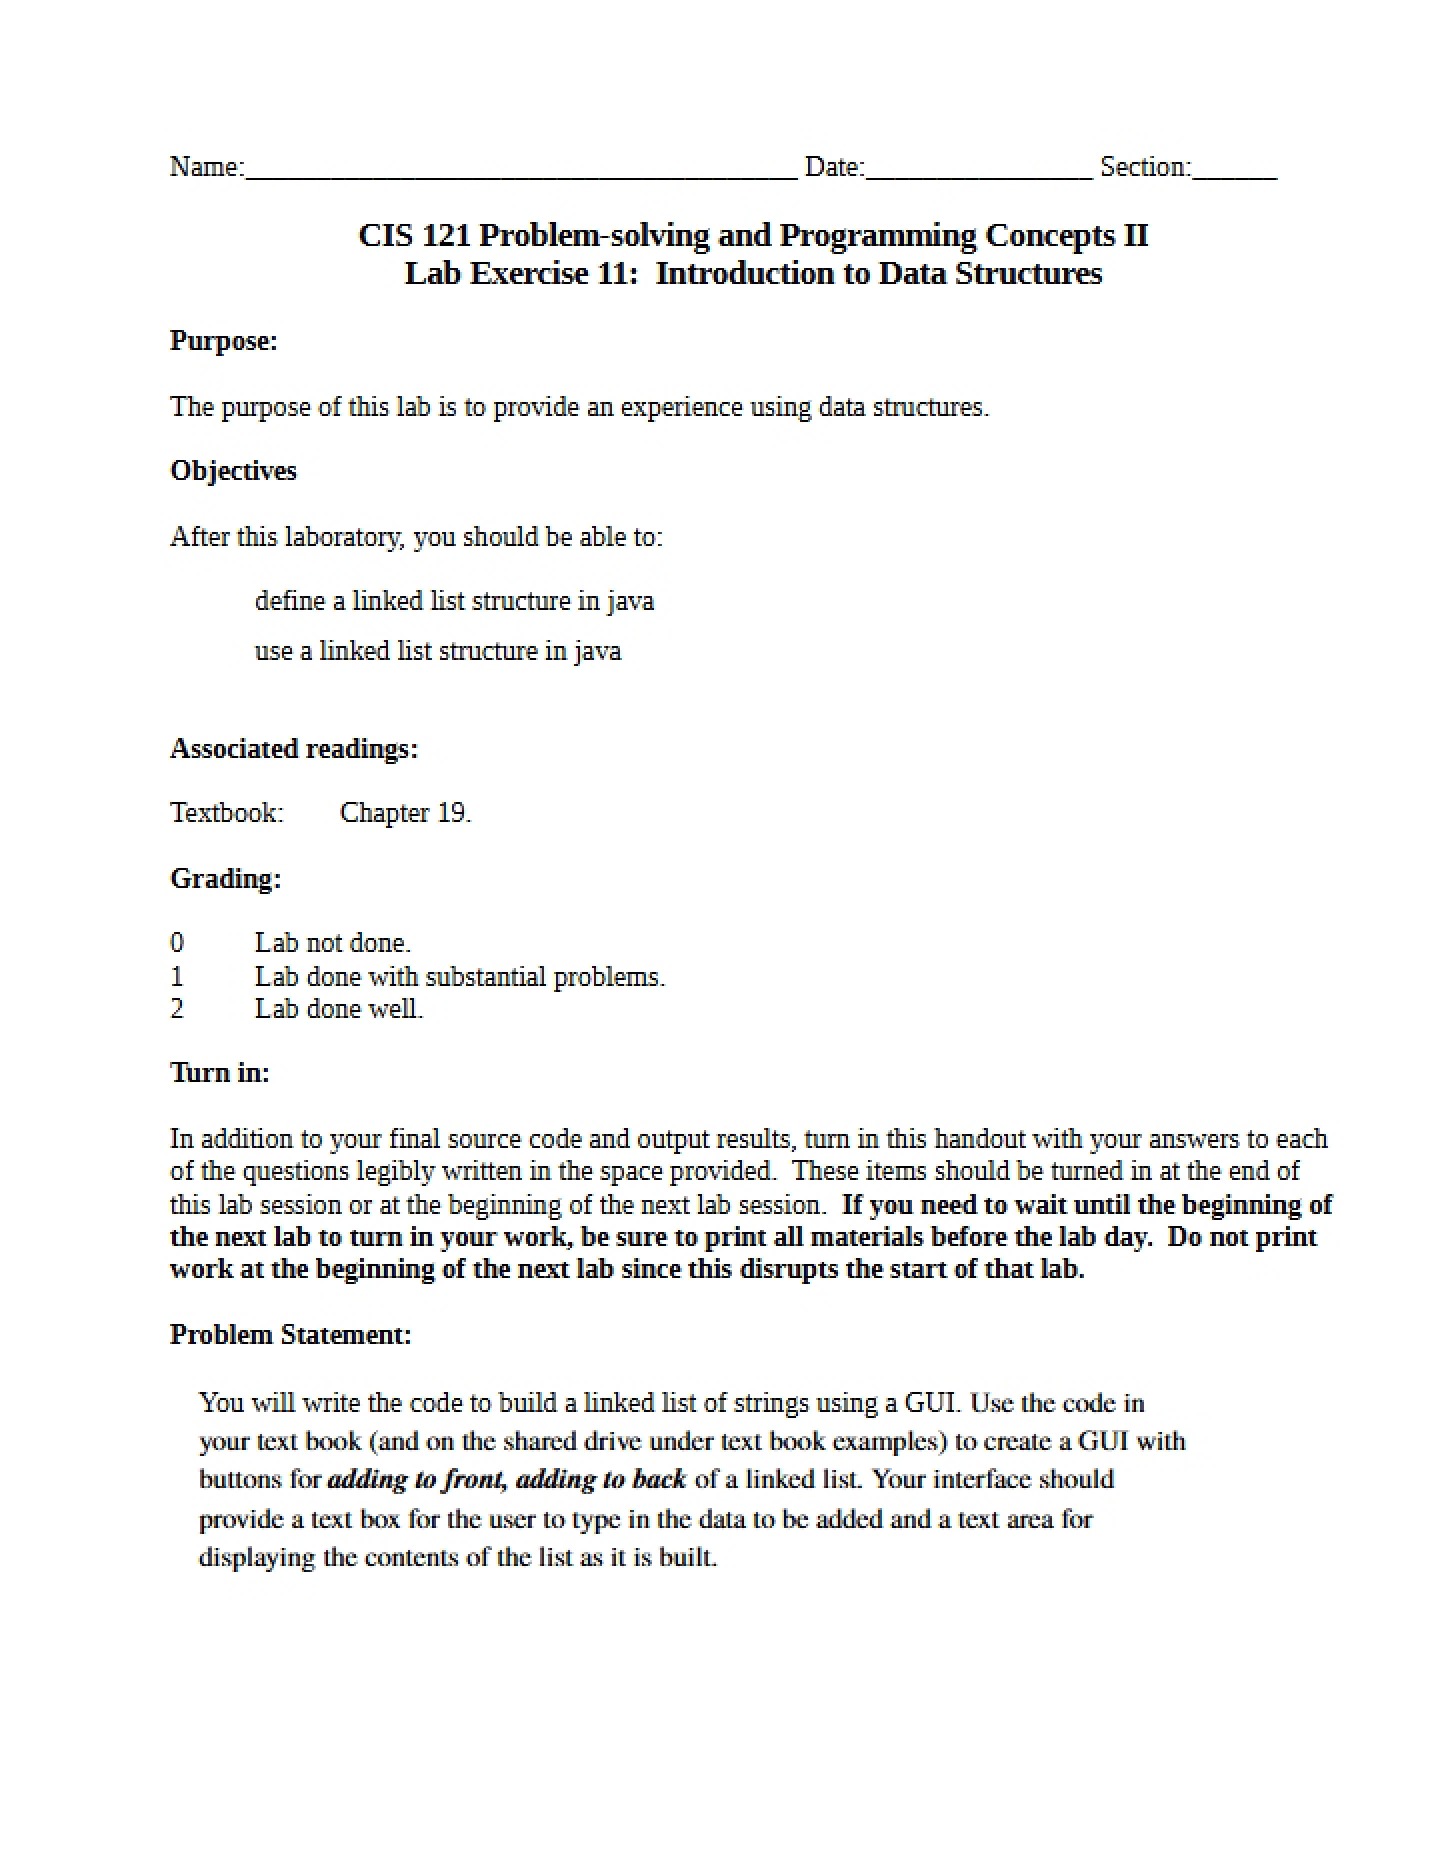
This is a lab exercise designed to build practical programming skills within an introductory to intermediate Java course. Specifically, it focuses on utilizing the Graphics class to visually represent data. The exercise guides students through the process of creating a bar chart, connecting programming concepts to a tangible visual output. It’s geared towards solidifying understanding of object-oriented programming principles within a graphical context.
Why This Document Matters
This resource is ideal for students enrolled in a problem-solving and programming concepts course, particularly those using Java. It’s most beneficial when you’re learning about graphical user interfaces (GUIs) and how to manipulate visual elements programmatically. If you’re struggling to translate data into visual representations or need a hands-on project to reinforce your understanding of the Graphics class, this lab will be a valuable tool. It’s designed to be completed during a lab session, offering a structured learning experience.
Common Limitations or Challenges
This lab focuses on a specific application – creating a bar chart – and doesn’t cover the broader range of possibilities within the Graphics class. It assumes a foundational understanding of Java syntax and object-oriented concepts. The exercise provides a starting point (a code skeleton) but requires students to actively write and debug code, so it won’t simply provide a ready-made solution. It also concentrates on a single data visualization technique and doesn’t explore alternative charting methods.
What This Document Provides
* A clearly defined programming problem centered around quarterly sales data.
* A structured series of exercises designed to build the bar chart incrementally.
* Guidance on utilizing core Java concepts like class constructors, paint methods, and event handling (window closing).
* Questions prompting critical thinking about code compilation, program behavior, and variable scope.
* A framework for understanding how to convert numerical data into visual representations using pixel-based graphics.
* A reference to associated textbook chapters for supplemental learning.